
Top 50 Questions & Answers Covering Data Science, Machine Learning, Deep Learning & SQL
Preparing for your next job? This complete guide on AI interview questions brings together the most asked data science interview questions, interview questions data science, machine learning interview, and deep learning interview, along with essential SQL and Python topics to help you crack your interview with confidence.
Top 50 Questions & Answers: Table of Contents
- Statistics and Probability
- Machine Learning
- Python for Data Science
- SQL and Databases
- Deep Learning & AI
- Case Studies and Business Thinking
Statistics and Probability in Data Science Interviews
When we step into the world of data science interview questions, we often begin with the foundations: statistics and probability. These are not just formulas or rigid definitions. They are lenses through which we can look at patterns, uncertainty, and the shape of knowledge itself. As learners, we must ask not only what the concepts mean, but also why they matter when we face a real case in an interview.
1. What is the difference between population and sample?
A population can be seen as the entire horizon of interest—the complete group we want to understand. It is vast, often hidden in its full form, like the whole world of adult women in a nation. A sample, by contrast, is a fragment of that horizon, a smaller group that we use as a proxy to learn from. For example, if we select 500 women from across regions, that becomes our sample.
Here we see a deeper issue: do we ever fully know the population, or do we always work with samples? This question reminds us that statistics is both a science of precision and a craft of approximation.
2. What is the Central Limit Theorem?
The Central Limit Theorem (CLT) invites us to reflect on how order emerges from randomness. It tells us that if we keep drawing samples, the means of those samples will begin to form a normal curve, no matter how irregular the population looks.
We might say it is like listening to many voices until a chorus emerges—the irregularities of individuals fade, and the collective sound is smooth. Yet, we must note the conditions: samples should be independent, reasonably large (often 30 or more), and drawn from a population with a finite mean and variance.
This theorem, often tested in machine learning interview questions, shows us how probability becomes a bridge between chaos and structure.
3. What are Type 1 and Type 2 errors?
Here we face a classic dilemma: the false positive (Type 1 error) versus the false negative (Type 2 error).
- A Type 1 error is when we reject a true null hypothesis, like a medical test saying someone is ill when they are not.
- A Type 2 error is when we fail to reject a false null hypothesis, like saying a person is healthy when they are in fact ill.
This trade-off reminds us of life itself: in trying to avoid one kind of mistake, we may walk straight into another. Interviews often ask us: which error matters more? The answer is rarely fixed. It depends on the case, the company, and the cost of being wrong.
4. What is a p-value?
The p-value is not just a number—it is a perspective on uncertainty. It tells us how surprising our result would be if the null hypothesis were true.
- If p < 0.05, we often say the evidence is strong enough to reject the null.
- If p ≥ 0.05, we pause and admit the evidence is not enough.
Imagine testing a new drug. If we see a p-value of 0.03, we know that such results would appear only 3 times in 100 if the drug had no effect. Should we reject the null? Many do, but we must also reflect: is 5% an absolute law, or just a convention?
5. What are confidence intervals?
A confidence interval is like a window into uncertainty. It does not give us a single number, but a range that holds the truth with some probability.
For example, a 95% confidence interval of [167 cm, 173 cm] for average height tells us: we are 95% confident the true mean lies in this span. But note—the interval is not the truth itself, it is only our best guide. Here lies the subtlety: are we satisfied with confidence, or do we seek certainty?
6. When do we use a t-test versus a z-test?
The t-test is often our tool when the sample is small and the population standard deviation is unknown. The z-test steps in when the sample is large and the population deviation is known.
This division asks us to think about scale. Do we trust the small and uncertain, or do we wait for the large and stable? Interviews sometimes test this judgment more than the formula itself.
7. What is the difference between correlation and covariance?
Covariance is like noticing whether two things move together—in the same or opposite direction. Correlation goes further: it standardizes that movement, showing both direction and strength on a scale from –1 to +1.
So, in our reasoning, covariance is raw, correlation is refined. Both matter, and both appear in data science interview questions.
8. What is a hypothesis test?
A hypothesis test is a framework for decision-making under uncertainty. We set a null hypothesis as the “default world,” and an alternative hypothesis as the “possible new world.” We choose a significance level, gather data, compute a test statistic, and then ask: do the results fit more with the null, or the alternative?
It is less a rigid answer and more a dialogue with evidence.
9. How does Bayes’ Theorem work?
Bayes’ Theorem gives us a way to update our beliefs. The formula is:
P(A|B) = [P(B|A) × P(A)] / P(B)
Imagine a medical test. Even if it is 99% accurate, if the disease is very rare, the chance that a positive result actually means disease can still be small. In one case, it may be only 17%. Here we see how intuition can fail us—probability offers a clearer lens.
10. What is overfitting and underfitting?
Finally, we meet two shadows of modeling: overfitting and underfitting.
- Overfitting is when a model knows the training data too well, capturing even the noise. It shines in practice tests but fails in the real world.
- Underfitting is when a model is too simple, missing the deeper patterns of reality.
This tension is not just technical; it is philosophical. Do we cling too tightly to what we know, or do we risk knowing too little? Interviews often ask us to explain this balance because it is central to both machine learning interview questions and deep learning interview discussions.
Machine Learning Interview Questions and Answers
11. What is the difference between supervised and unsupervised learning?
When we look at machine learning through the lens of guidance, we often come across two kinds of learning: supervised and unsupervised. In supervised learning, the algorithm is trained on a dataset that already has labels. We, as learners, can see how inputs are tied to outputs, and the task is to uncover that mapping. This is the space of classification and regression, where tools like linear regression, decision trees, or SVMs come into play.
In contrast, unsupervised learning has no such labels. Here, we step into the unknown, asking the system to reveal hidden structures. It is less about answers and more about exploration. Methods such as clustering (like K-means) or dimensionality reduction (like PCA) guide us into patterns that were not obvious. One might ask: is supervised learning about answers, while unsupervised is about questions? That tension remains a point of reflection.
12. What is the bias-variance tradeoff?
The bias-variance tradeoff is like looking at two sides of the same coin of error. Bias comes from oversimplification, where a model is too rigid. It has got the tendency to underfit—like using a straight line to capture the curve of life. Variance, on the other hand, reflects the model’s sensitivity, where small changes in data lead to large swings. This overfitting captures noise as though it were signal.
As complexity grows, bias falls but variance rises. The art lies not in choosing one over the other, but in finding balance. This tradeoff is not a fixed answer but a question we carry into every model we build.
13. What are precision, recall, F-score, and accuracy?
In the world of evaluation, we often ask: how good is our model at telling the truth? Precision shows us how many of the predicted positives are right. Recall, instead, looks at how many of the actual positives we were able to find. Accuracy takes a wider view, counting all correct predictions across classes.
Yet precision and recall can conflict. That is why the F1 score, a harmonic mean, becomes a kind of compromise. It reminds us that truth is not always in one number but in perspective.
14. What is the ROC-AUC curve?
The ROC curve is like a lens to view the dance between true positives and false positives. By plotting these rates across thresholds, we see not just a score but a story of performance.
The AUC, or the area under the curve, gives us a measure: a value of 1 signals perfection, 0.5 suggests random guessing, and less than 0.5 implies something worse than chance. But perhaps the real insight lies in the curve itself, showing us the tradeoffs we face when deciding thresholds in practice.
15. Explain the K-Nearest Neighbors (K-NN) algorithm.
K-NN works on a simple but profound idea: things that are close often share similarity. We begin by choosing a number, K, then we measure distances—be it Euclidean, Manhattan, or others. The nearest neighbors “vote,” and the model predicts accordingly.
It is straightforward and often powerful, but we must reflect on its issues: it can be slow for large datasets, and irrelevant features can mislead it. So, K-NN is not just about neighbors but about the quality of the space we measure in.
16. How does a decision tree work?
A decision tree is a branching path where each split represents a choice. We look for the best feature to divide the data, often using Gini impurity or information gain. From root to leaf, the process continues until we decide it should stop.
It is clear, interpretable, and able to work with different types of variables. Yet it also carries risks: overfitting is common, and even small shifts in data may change the tree. Here, transparency and fragility coexist.
17. What is bagging vs boosting?
Both bagging and boosting fall under the metaphor of “wisdom in numbers.” Bagging, or bootstrap aggregating, is about building many models in parallel, each trained on different samples, and then combining their voices through averaging or voting. Random Forest is a familiar example.
Boosting, however, is sequential. Each new model tries to correct the mistakes of the last, gradually building a strong learner from weak ones. AdaBoost, Gradient Boosting, and XGBoost are names we often meet here. Bagging reduces variance; boosting reduces bias. The real question is not which is better, but which fits the problem before us.
18. Explain Random Forest.
Random Forest extends the idea of bagging with a twist. Not only does it use bootstrap sampling, but it also selects random subsets of features at each split. This diversity helps reduce overfitting. The result is an ensemble that is accurate and robust, even for large datasets.
Yet, as with any forest, we may lose sight of individual trees. Interpretability suffers, and the model can be memory-hungry. So while it often works well, it raises questions about transparency and practicality.
19. What is cross-validation and why is it important?
Cross-validation is a mirror through which we check how well a model may generalize. In k-fold cross-validation, we divide data into k parts, train on some, and test on the rest, repeating until every fold has played both roles.
It makes good use of limited data, reduces overfitting risk, and gives a fairer sense of performance. Still, it takes more time and computation. The question for us is: do we value efficiency, or do we prefer deeper confidence in results?
20. What are the assumptions of linear regression?
Linear regression rests on several assumptions, each like a foundation stone. We assume linearity in relationships, independence among observations, and homoscedasticity—equal spread of residuals. We also assume that residuals follow a normal distribution.
In addition, we ask that independent variables are not strongly correlated (to avoid multicollinearity) and are not linked to error terms (to avoid endogeneity). If these assumptions fail, so too may the model. But the reflection remains: in the real world, how often do we perfectly meet such ideals?
Python for Data Science
21. What are Python libraries commonly used in data science?
When we look into the world of data science, we often begin with tools that can help us see patterns and shape numbers into meaning. Python has given us libraries that act as lenses. For data manipulation, we work with Pandas, which lets us hold information in structures like DataFrames, and NumPy, which gives us the foundation of arrays and numerical work. For visualization, we use Matplotlib and Seaborn when we want to see the form of data in static plots, while Plotly lets us go deeper into interaction. In machine learning, we often start with Scikit-learn and then move into more powerful engines like XGBoost, TensorFlow, or PyTorch when we need depth in modeling. For statistics, Statsmodels and SciPy offer us ways to test, compare, and reason. Each library, in its own way, gives us a different view of the same issue—the fact that data has both structure and story.
22. Difference between list, tuple, and set
We may ask, what is the nature of holding data in Python? A list can be changed, ordered, and hold duplicates. A tuple is fixed, ordered, and cannot be altered, so it speaks of stability. A set allows no duplicates, is unordered, and does not keep an index. We might say that lists are for everyday use, tuples for when the form should not change, and sets when uniqueness matters. Each has its place, yet the choice depends on what we value—flexibility, permanence, or distinction.
23. What is a lambda function?
A lambda function is like a small light in the code—short, quick, and often unnamed. It is written as lambda arguments: expression. For instance, lambda x, y: x + y gives us a sum without ceremony. When we use it with built-ins like sorted(), it becomes a quiet helper. It shows us that not all functions need a name to do work; some are born, used, and gone in the same line.
24. What is the use of pandas groupby()?
In data analysis, we often look not at individuals but at groups. The groupby() in Pandas allows us to split, apply, and combine. We can take a company dataset, group by “Department,” and find the mean salary. It reflects a common human act: to see the whole by first dividing it into parts. Yet we must ask—does grouping clarify the truth, or does it hide the outliers we ought to notice?
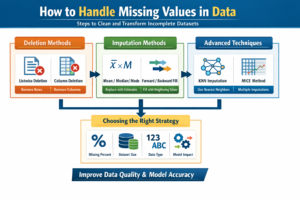
25. How do you handle missing data in pandas?
Missing values raise an issue for us: do we ignore what is absent, or do we try to fill the gap? Pandas lets us check with .isnull() and then decide. We may drop rows with dropna(), or we may fill them—with zeros, with means, with interpolation. Each way has meaning. To remove is to risk losing information; to fill is to risk assuming what is not there. The question remains: what do we value more—completeness or fidelity?
26. What is the difference between apply(), map(), and applymap()?
These three functions let us turn data in different ways. map() works on a Series, changing each element. apply() works on both Series and DataFrames, letting us apply across rows or columns. applymap() looks into every cell of a DataFrame. The difference is in scope: part, whole, or all. It shows us that the same act of transformation can be seen from many levels.
27. How do you read and write files using pandas?
Reading and writing are the hands of data science. With Pandas, we read from CSV, Excel, or JSON using read_csv(), read_excel(), or read_json(). We also write with to_csv(), to_excel(), or to_json(). Here we see the bridge between raw files and structured tables. The act is simple, yet the choice of format can change the way the data travels, the way it is seen, and the way it is shared.
28. What are Python decorators?
A decorator in Python is like a frame around a painting. It does not change the art itself but changes how it is presented. It wraps a function, adding behavior before and after. We may use it to log, to check, to time. The decorator reminds us that context can change meaning, that sometimes what surrounds an action is as important as the action itself.
29. What is the difference between deep copy and shallow copy?
When we copy in Python, we must ask—what is being copied? A shallow copy makes a new object but keeps references to nested ones. A deep copy makes a full, separate version. With shallow copy, changes ripple across; with deep copy, each stands alone. Both ways are true to life: sometimes we want connection, sometimes independence.
30. How does NumPy handle broadcasting?
Broadcasting in NumPy is a way to make arrays of different shapes work together in arithmetic. It aligns shapes from the right, and when dimensions are unequal, it stretches the smaller one. This is efficient, but also metaphorical—it shows how, in mathematics and in thought, we can extend small ideas to fit larger frames. Yet we must be careful: not every stretch is valid, and sometimes the fit can be misleading.
SQL and Databases
When we step into the world of SQL interview questions, we find ourselves asking not just what the commands are, but why we use them and how they change our view of data. Let us look together at some core issues that shape how we think about databases.
31. What is the difference between INNER JOIN, LEFT JOIN, and FULL OUTER JOIN?
We often look at joins as lenses that decide how two tables are brought together.
- INNER JOIN lets us see only the rows that fit on both sides.
- LEFT JOIN keeps all the rows of the first table, even if the second has nothing to match.
- FULL OUTER JOIN opens the widest view, showing us every row from both, whether they fit or not.
This makes us ask: are we looking for strict matches, or do we need to keep what is left unseen?
32. How do you find duplicate records in a table?
Duplicates are not always just a mistake; sometimes they are a sign of deeper structure in data.
We may check them by grouping and counting:
SELECT email, COUNT(*)
FROM employees
GROUP BY email
HAVING COUNT(*) > 1;
Or we may want to look at the actual repeated rows:
SELECT *
FROM employees
WHERE email IN (
SELECT email
FROM employees
GROUP BY email
HAVING COUNT(*) > 1
);
The real question for us is: when is duplication a problem, and when is it part of the truth we want to keep?
33. What is a window function?
A window function allows us to look at one row in the light of others, without losing its own detail.
For example, a running total:
SELECT employee_id, sale_date, amount,
SUM(amount) OVER (
PARTITION BY employee_id
ORDER BY sale_date
ROWS BETWEEN UNBOUNDED PRECEDING AND CURRENT ROW
) AS running_total
FROM sales;
Here, each number lives on its own, but also as part of a longer story.
34. What is the difference between WHERE and HAVING?
This difference is small in syntax, but big in meaning.
- WHERE works on individual rows before they are grouped.
- HAVING works after aggregation, filtering groups instead of single rows.
So the issue is not only what we filter, but when we do it.
35. What is normalization? Why is it important?
Normalization is like bringing order into a crowded room. We break data into smaller, related parts to reduce repetition and protect meaning.
- It cuts down duplication.
- It improves clarity and consistency.
- It can help performance, though some argue denormalization is better for speed.
This debate—order vs. speed—shows us that no design is final. Each case asks for its own balance.
36. How do you optimize SQL queries?
Optimization is less about tricks and more about perspective. We can:
- Use indexes on key columns.
- Avoid SELECT * and instead pick what we need.
- Filter early with WHERE.
- Work with execution plans to see hidden costs.
- Choose the right data types.
- Keep joins precise.
Yet we must ask: do we always want faster queries, or sometimes is clarity and simplicity the greater need?
37. Write a SQL query to get the second highest salary
There are different ways to see the “second highest”:
Using LIMIT and OFFSET:
SELECT DISTINCT salary
FROM employees
ORDER BY salary DESC
LIMIT 1 OFFSET 1;
Using a subquery:
SELECT MAX(salary) AS second_highest_salary
FROM employees
WHERE salary < (SELECT MAX(salary) FROM employees);
Each approach gives us the same answer, but in a different style. Which one feels more natural to us depends on context.
38. What is a CTE (Common Table Expression)?
A CTE is like a temporary window into data. It lets us give a name to a query and use it again.
Example:
WITH high_salary_employees AS (
SELECT id, name, salary
FROM employees
WHERE salary > 80000
)
SELECT name
FROM high_salary_employees
WHERE name LIKE ‘A%’;
We may also step into recursion, building hierarchies of managers and employees. It shows us how queries can reflect real-life chains of command.
39. Explain ACID properties of databases
When we think about transactions, ACID gives us a philosophical frame:
- Atomicity: all or nothing.
- Consistency: from one valid state to the next.
- Isolation: transactions stand alone, unseen by others until complete.
- Durability: once written, it remains, even against failure.
This balance between fragility and permanence makes us reflect on trust in systems.
40. What are indexes and how do they improve performance?
Indexes are like signposts. They do not change the road, but they help us move faster.
- They work by sorting and referencing data.
- They turn searching from a long walk into a quick jump.
- They support WHERE, JOIN, and ORDER BY.
But as with all shortcuts, there is a trade-off. Indexes make reads faster but can slow down inserts and updates, and they take space.
So again, we ask: what do we value more—the speed of access, or the flexibility of constant change?
Deep Learning & AI
41. What is the difference between CNN and RNN?
When we look at neural networks, we often see two dominant forms—Convolutional Neural Networks (CNNs) and Recurrent Neural Networks (RNNs). A CNN can be seen as a lens designed to capture the spatial form of data. It works well in images, where local patterns matter more than sequential order. RNNs, by contrast, are like a memory thread, keeping traces of what has come before. They are suited for text or time-series, where each moment depends on the last. Yet, the question remains: do we need context (RNN) or structure (CNN)? That choice depends on the kind of issue and the way data flows.
42. What is backpropagation?
Backpropagation is the method by which a network learns from mistakes. We pass input forward, compare its output to truth, then let the error flow backward. This flow is like a mirror showing us where change is needed. Through gradients, we adjust weights, step by step, with learning rate guiding the pace. Some may say it is purely mechanical, but if we look deeper, it reflects how we humans also learn—through trial, error, and correction.
43. What is the vanishing gradient problem?
In very deep networks, we face an issue: gradients may shrink so much that the early layers hardly learn. It is as if the signal fades as we move back in time. Sigmoid or tanh functions often make this worse, while ReLU and residual paths help us keep the flow alive. We might ask: is this a problem of mathematics alone, or of how we think about depth? Both sides offer lessons—the elegance of theory, and the pragmatism of design.
44. What is dropout and why is it used?
Dropout can be thought of as silence within learning. By randomly removing neurons during training, we prevent the network from becoming too dependent on certain voices. At inference, all neurons return, but the memory of disruption makes the model more robust. Some may argue this adds noise, yet others see it as discipline—forcing the system to generalize, not memorize.
45. When do we choose neural networks over traditional ML algorithms?
We often face the question: when do we step into the world of deep networks, and when do we stay with traditional methods? Neural networks fit when we have vast data, complex non-linear patterns, or unstructured inputs like images and speech. They give us power, but demand resources. Traditional ML, however, works well with small datasets, need for clarity, or limited compute. In this tension, we see the larger debate: complexity vs simplicity, black-box vs interpretability. The answer may not be fixed, but dependent on what issue we face, what time we have, and what balance we want.
Case Studies and Business Thinking
46. How would you detect fraud using transaction data?
Fraud detection is less about a single algorithm and more about perspective. We clean data, create features of time, place, and behavior, then test models—Random Forest, XGBoost, Neural Networks, Isolation Forest. Yet, the real question is not just which model, but how well it adapts to shifting human intent. Fraud is dynamic. We may ask: can numbers alone capture deception, or do we need a continual dialogue between model and analyst?
47. How would you design an A/B test?
An A/B test is like holding up two mirrors to reality. We define a goal, split groups, assign randomly, and measure. But behind the mechanics lies a question: do numbers alone capture the whole truth? A test can show us what works better, but it cannot always tell us why. We balance rigor with interpretation, keeping both statistical significance and practical sense in view.
48. Model accuracy is high but business results are poor. What do we do?
This is a case where the lens of data science and the lens of business are misaligned. Accuracy may look strong, yet the output may not turn into impact. Here, we must step back. Ask: are we measuring the right thing? Are predictions turning into action? Are stakeholders using the model as intended? Sometimes the issue lies not in the model, but in how it is woven into the life of the company.
49. What KPIs would you track for an e-commerce recommendation system?
KPIs form the compass of recommendation systems. On one hand, we check system metrics like CTR, conversion, add-to-cart rate. On the other, we reflect on business—uplift in revenue, lifetime value, ROI. Yet there is also the softer side: user trust, diversity of options, fairness. Numbers guide us, but they cannot fully tell us how a person feels about a suggestion. So, which metrics matter more? Perhaps it depends on what we, as a group, value most in that moment.
50. How would you explain a complex model to a non-technical stakeholder?
When speaking to those outside our field, we must leave behind jargon and turn to metaphor. A model can be like a map, or like a GPS guiding decisions. We start from business outcomes, then work back to mechanics, using visuals, stories, and simple terms. But honesty matters too—we share accuracy, but also limits. In such dialogue, explanation becomes less about teaching and more about shared understanding.
Conclusion
In this guide, we have walked through many of the AI interview questions, data science interview questions, machine learning challenges, SQL exercises, and deep learning reflections that often shape the journey of candidates. Each question is not just a test of memory, but a window into the ways we, as data practitioners, think about problems in the real world.
We can look at them as lenses. One lens shows us the quantitative side—precise formulas, algorithms, and structured answers. Another lens shows us the qualitative side—how we explain, how we fit insights into business needs, and how we reason about people, not just numbers. Both are needed. Both come with value.
What we may see, then, is that success in interviews does not rest only in having the right fact at the right time. It is also in how we know when to apply a method, why a choice makes sense in context, and what trade-offs can arise. Some of us may lean toward the technical depth, while others may prefer the business perspective. Neither is wrong. Together, they form the whole picture.
As we prepare, we can ask ourselves: are we just collecting answers, or are we learning to think in ways that adapt to different cases, companies, and challenges? In the end, the interview is less about showing that we have got every detail, and more about showing how we think, how we connect, and how we bring value into a larger system of work.
Next Step – Explore Services with Craze Neurons
When we look at the path to growing our skills, career, or business, we find that it is not only about time or effort but about the ways in which we use guidance, tools, and experience. At Craze Neurons, we offer a set of services that can act as a lens into knowledge, performance, and opportunity. Through these offerings, we can see the depth of learning and the perspective that comes from practical engagement.
- Upskilling Training – We provide hands-on training in Data Science, Python, AI, and related fields. This is a way for us to look at learning from both practical and conceptual perspectives.
👉 Click here to know more: https://wa.me/918368195998?text=I%20want%20to%20Upskill%20with%20Craze%20Neurons - ATS-Friendly Resume – Our team can craft resumes that are optimized for Applicant Tracking Systems (ATS), highlighting skills, experiences, and achievements. This service is available at ₹599, providing a tangible way for us to make first impressions count.
👉 Click here to know more: https://wa.me/918368195998?text=I%20want%20an%20ATS-Friendly%20Resume%20from%20Craze%20Neurons - Web Development – We build responsive, SEO-friendly websites that can be a framework for growth. It is a way for us to put ideas into structure, visibility, and functionality.
👉 Click here to know more: https://wa.me/918368195998?text=I%20want%20a%20Website%20from%20Craze%20Neurons - Android Projects – These are real-time projects designed with the latest tech stack, allowing us to learn by doing. Guided mentorship gives us a chance to look at development from a practical lens and to understand the why behind each decision.
👉 Click here to know more: https://wa.me/918368195998?text=I%20want%20an%20Android%20Project%20with%20Guidance - Digital Marketing – We provide campaigns in SEO, social media, content, and email marketing, which can be used to see our brand’s reach and engagement from a deeper perspective.
👉 Click here to know more: https://wa.me/918368195998?text=I%20want%20Digital%20Marketing%20Support - Research Writing – We deliver plagiarism-free thesis, reports, and papers, which can help us explore knowledge, present ideas, and communicate insight with clarity.
👉 Click here to know more: https://wa.me/918368195998?text=I%20want%20Research%20Writing%20Support
In all these services, we can see that learning, building, promoting, or publishing is not just a task but a process of discovery. It is a way for us to understand, measure, and reflect on what is possible when guidance meets effort.
❓ Frequently Asked Questions (FAQs) – Craze Neurons Services
1. What is included in the Upskilling Training?
We provide hands-on training in Data Science, Python, AI, and allied fields. This allows us to work with concepts and projects, see practical applications, and explore the deeper understanding of each topic.
2. How does the ATS-Friendly Resume service work?
Our team crafts ATS-optimized resumes that highlight skills, experience, and achievements. This is a service priced at ₹599 and acts as a lens to make the first impression clear, measurable, and effective.
3. What kind of websites can Craze Neurons build?
We build responsive and SEO-friendly websites for businesses, personal portfolios, and e-commerce platforms. This enables us to translate ideas into structure, visibility, and functional design.
4. What are the Android Projects about?
We offer real-time Android projects with guided mentorship. This gives us an opportunity to learn by doing, understand development from multiple angles, and apply knowledge in a controlled, real-world context.
5. What does Digital Marketing service include?
Our service covers SEO, social media campaigns, content marketing, and email strategy, allowing us to look at brand growth quantitatively and qualitatively, understanding what works and why.
6. What type of Research Writing do you provide?
We provide plagiarism-free academic and professional content, including thesis, reports, and papers. This allows us to express ideas, support arguments, and explore knowledge with depth and precision.
7. How can I get started with Craze Neurons services?
We can begin by clicking the WhatsApp link for the service we are interested in. This lets us communicate directly with the team and explore the steps together.
8. Can I use multiple services together?
Yes, we can combine training, resume, web, Android, digital marketing, and research services. This allows us to see synergies, plan strategically, and use resources effectively.
9. Is the training suitable for beginners?
Absolutely. The courses are designed for learners at all levels. They allow us to progress step by step, integrate projects, and build confidence alongside skills.
10. How long does it take to complete a service or course?
Duration depends on the service. Training programs vary by course length. Projects may take a few weeks, while resume, website, or research work can often be completed within a few days. This helps us plan, manage, and achieve outcomes efficiently.
Stay Connected with Us
🌐 Website: www.crazeneurons.com
📢 Telegram: https://t.me/cenjob
📸 Instagram: https://www.instagram.com/crazeneurons
💼 LinkedIn: https://www.linkedin.com/company/crazeneurons
▶️ YouTube:https://www.youtube.com/@CrazeNeurons
📲 WhatsApp: +91 83681 95998


3 Responses
Thanks You So Much for Content
This is a very well-structured and thoughtful compilation of AI interview questions. I really liked how the explanations go beyond definitions and focus on reasoning, trade-offs, and real interview context—especially in sections like overfitting vs underfitting and the business case studies. That reflective approach is what interviewers actually look for. I’ve seen similar emphasis on structured thinking and clarity when exploring interview support content on LockedIn AI, where the focus is also on how candidates explain their thinking, not just what they know. Thanks for putting together such a comprehensive guide.
Thank you for your thoughtful feedback. We’re glad you found the guide valuable and aligned with real interview expectations.
For more insights on structured thinking, AI concepts, and interview preparation strategies, we invite you to explore our latest blog articles at Crazy Neurons — available at crazeneurons.com