

Do you wonder how businesses make informed decisions using data or how analysts can spot patterns in an ocean of numbers? Welcome to the realm of data analysis—a vital skill in today’s data-driven era.
What is Data Analysis?
Data analysis is the process of acquiring, cleaning, exploring, modeling, and interpreting data to uncover valuable information, make conclusions, and enable decision-making. Whether you’re analyzing sales reports, survey feedback, or website usage, the end goal is to transform raw data into usable insights.
Why is Data Analysis Important?
In virtually all sectors—healthcare, business, education, or sports—information is constantly generated. Without data analysis, that information remains untapped potential. Here’s why it matters:
- Uncover trends and hidden patterns
- Make informed, data-driven decisions
- Improve efficiency and product/service quality
- Predict future outcomes
- Manage risk more effectively
Steps in the Data Analysis Process
- Define the Objective: Begin with a clear question: What do you want to know? A defined objective guides the entire analysis.
- Gather the Data: Collect data from reliable sources such as surveys, databases, APIs, web scraping, or public datasets.
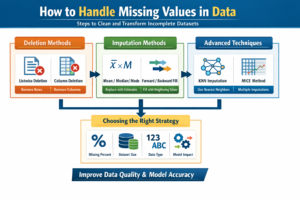
- Clean the Data: Eliminate duplicates, handle missing values, fix errors, and normalize formats to ensure accuracy.
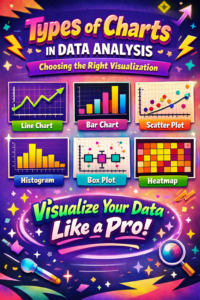
- Conduct Exploratory Data Analysis (EDA): Use visualization and statistics tools like heatmaps, scatter plots, and histograms to examine data and spot trends or anomalies.
- Apply Statistical or Machine Learning Models: Use techniques like clustering, regression, or classification to gain insights or make predictions.
- Interpret Results and Act: Translate numbers into real-world insights and actionable recommendations. Share results through dashboards, reports, or visualizations.
Tools Used in Data Analysis
To work efficiently, analysts rely on a variety of tools, including:
- Spreadsheets: Excel, Google Sheets
- Programming Languages: Python (pandas, NumPy, matplotlib), R
- Visualization Tools: Tableau, Power BI, Seaborn
- Databases: SQL, MongoDB
- Big Data Tools: Hadoop, Spark
Real-World Example of Data Analysis
Case Study: An online store experiences a 20% drop in sales.
- The team tracks sales, ad performance, and website traffic
- The data is cleaned and visualized using time-series plots
- The analysis shows reduced marketing spend and website bugs as key issues
- Based on insights, the store fixes bugs and increases ad spend—sales begin to recover
Applications of Data Analysis
- Business Intelligence: Sales forecasting, KPI tracking
- Healthcare: Patient monitoring, disease prediction
- Finance: Stock analysis, fraud detection
- Education: Student performance tracking, curriculum enhancement
- Marketing: Customer segmentation, campaign analysis
A Brief History of Data Analysis
- Ancient Times: Used in trade and astronomy
- 17th–18th Century: Rise of statistics (e.g., Pascal, Bayes, Graunt)
- 20th Century: Evolution of statistical theory and early computing
- 1990s–2000s: Emergence of big data, internet, and data mining
- 2010s–Present: Rise of machine learning, AI, and real-time analytics
Benefits of Data Analysis
- Improves decision-making accuracy
- Saves time and reduces costs
- Reveals opportunities for innovation
- Enables personalized experiences
- Enhances risk detection and prevention
- Measures performance and efficiency
Limitations of Data Analysis
- High cost of tools and skilled professionals
- Time-consuming data preparation
- Risk of misinterpretation
- Ethical and privacy concerns
- Inaccurate results from low-quality data
- Overfitting or misleading patterns
- AI models may be complex and hard to interpret
Conclusion
In this blog, we explored how data analysis transforms raw data into meaningful insights. From understanding customer behavior to improving healthcare systems, data analysis is now central to decision-making across industries.
Whether you’re just beginning or aiming to become a professional data analyst or data scientist, mastering these steps and tools is essential for success in the digital age.Ready to learn more? Stay tuned for upcoming blogs on Python for Data Analysis, Tableau Dashboards, and Machine Learning.

One Response
Great beginner-friendly guide! I like how it explains the full process—from cleaning to modeling—and reminds us that tools like Excel, Python, or Tableau are just lenses to turn raw data into meaningful insights. A good balance of theory and practice for anyone starting in data analysis.