To become job-ready in data analysis, build strong analytical foundations through resources like future data analytics trends, understand why data skills matter today, master data analysis tools, learn Python for data analysis, explore web scraping, deepen your understanding of data types, strengthen employability with an ATS-friendly resume, and study essential Python libraries.
Python is among the simplest yet strongest instruments for obtaining a job in data analysis. However, numerous newbies—mainly those hailing from non-tech fields—question the following:
- 👉 “How long will it take me to learn?”
- 👉 “Which topics should I cover each month?”
- 👉 “Is it possible that I would be industry-ready?”
The answer is: ABSOLUTELY!
With a proper plan, you can be ready for the job market in 5–6 months.
- The blog is all about the full ride with:
- A month-by-month roadmap
- Code snippets
- Pictures of the output
- Easy-to-understand explanations
- A neat timeline visualization
📊 TIMELINE VISUALIZATION
This chart displays the month-by-month growth of your reading skill:
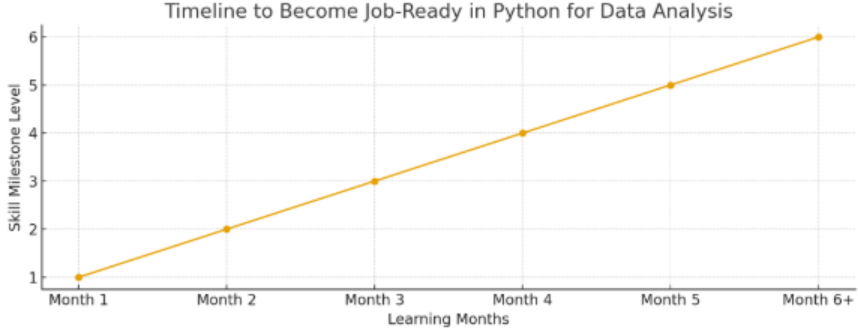
This graph is a basic pictorial representation indicating the enhancement of your skills from Month 1 to Month 6 which are required for a job in Python for Data Analysis.
What This Timeline Visualization Means
The timeline plot was a visual representation of your road map showing:
the growth of skills each month
Your skill level goes up gradually from Month 1 to Month 6+.
Milestones in learning are indicated by each dot on the graph.
- Month 1 = Beginner
- Month 2 = Introduction to handling data
- Month 3 = Data representation
- Month 4 = Grasp of statistics
- Month 5 = Project professional
- Month 6+ = Ready for employment
The line is rising upward
| Skill Level | Meaning |
| 1 | Learning basics |
| 2 | Mastering data handling |
| 3 | Mastering visualizations |
| 4 | Learning statistics |
| 5 | Performing numerous projects |
| 6 | I am ready for the job. |
Development is geared towards an upward trend given that every month you tender laudable performances. Why is this plot useful for your blog?
Because it:
✔ Makes readers understand the journey visually
✔ Shows a structured plan
✔ Builds trust
✔ Helps non-technical readers “see” the progress
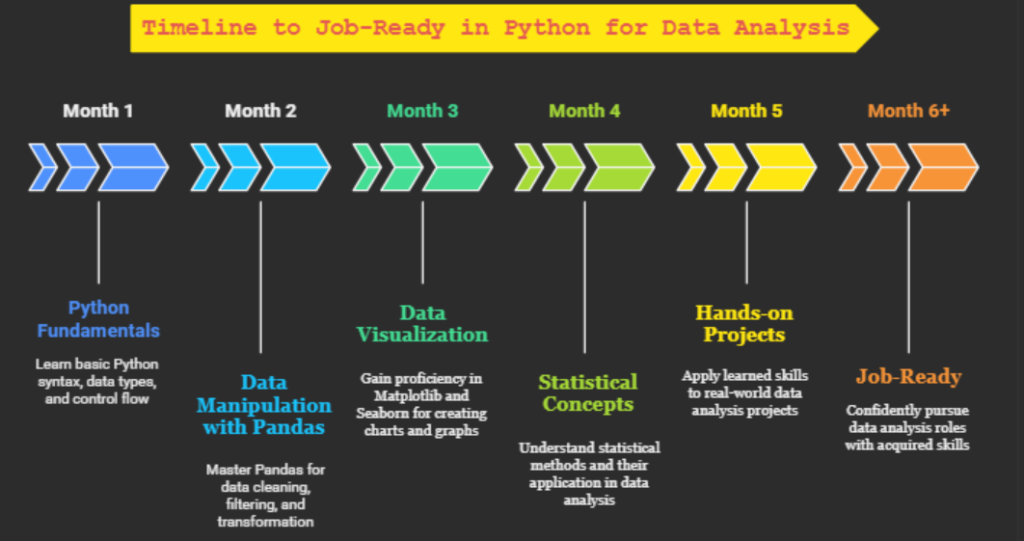
MONTH 1 — Python Fundamentals
What you learn
- Basic syntax
- Variables
- Data types
- Loops
- Conditions
- Functions
Why it matters
That is the way. The basics are for every undertaking at the beginning.
Example Code
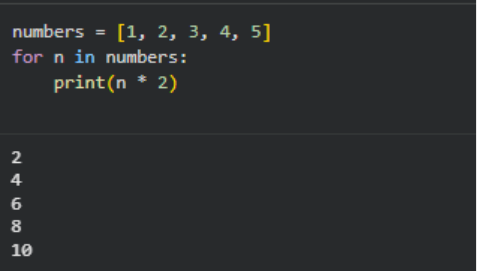
Shows loops + list concepts clearly.
MONTH 2 — Data Manipulation with Pandas
What you learn
- Reading CSV files
- Cleaning data
- Handling missing values
- Filtering rows
- Grouping
- Creating new columns
Why it matters
The role of a data analyst is 80% cleaning messy data.
Example Code
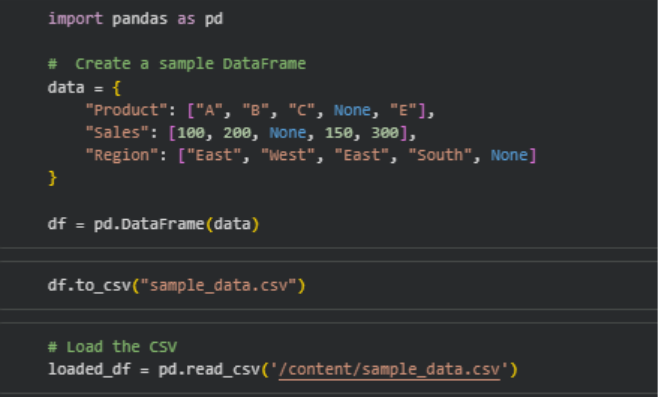
Show readers what data cleaning means.
- Generating a sample dataset
- Exporting it to CSV
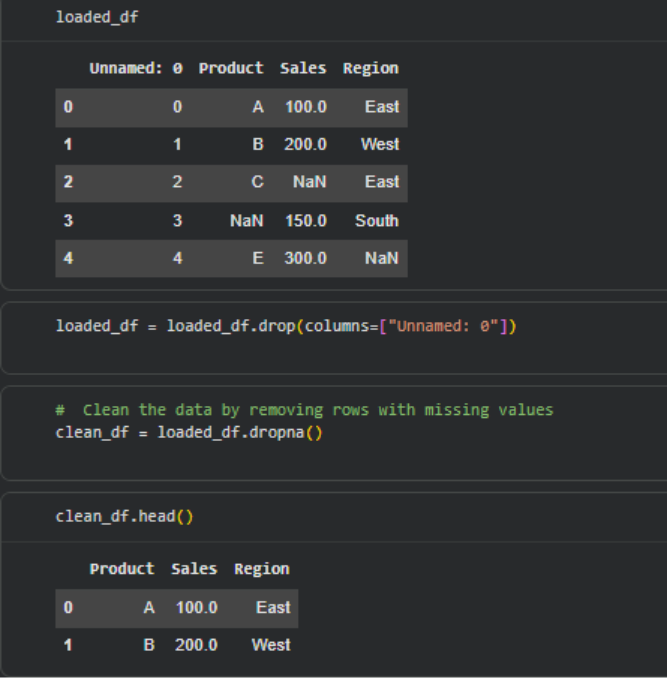
- Importing the CSV
- Observing an unnecessary “Unnamed: 0” column
- Eliminating that unnamed column
- Data cleansing through the removal of rows with nulls
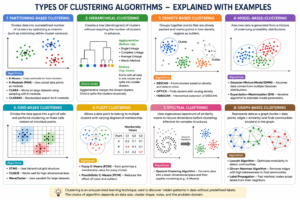
MONTH 3 — Data Visualization
What you learn
- Matplotlib
- Seaborn
- Bar charts, pie charts, histograms
- Trends & patterns
Why it matters
Businesses find pictures most useful, because it tells a quick story.
Example Plot
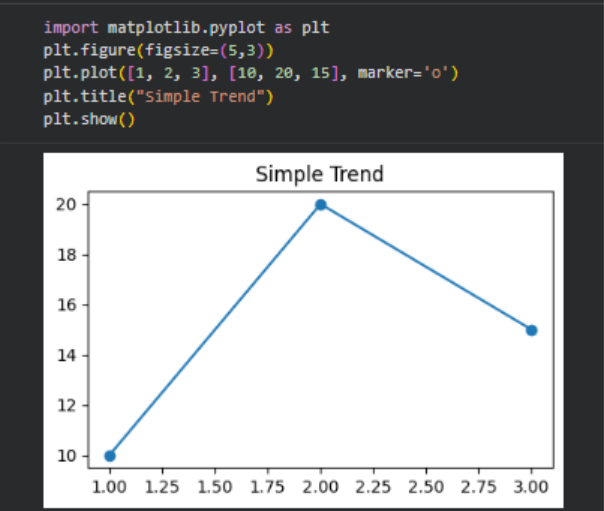
Show readers what this plot represents
- Displays a rapid ascend and descend—trend can be identified in a couple of seconds.
- Marks the highest point right away without having to look at the numbers. Discloses the variations in performance over time with a quick glance (beginning → highest point → decline).
- The difference is between raw data and visual representation. Communicates the entire narrative quicker than a chart or a paragraph.
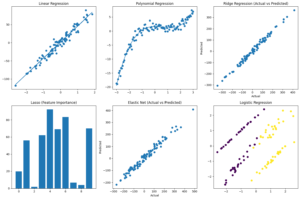
MONTH 4 — Statistical Concepts
What you learn
- Mean, median, mode
- Correlation
- Probability
- Hypothesis testing
Why it matters
Any company will want analysts who look at why something happened, in addition to what happened.
Example: 1. Mean, Median, Mode (Central Tendency)
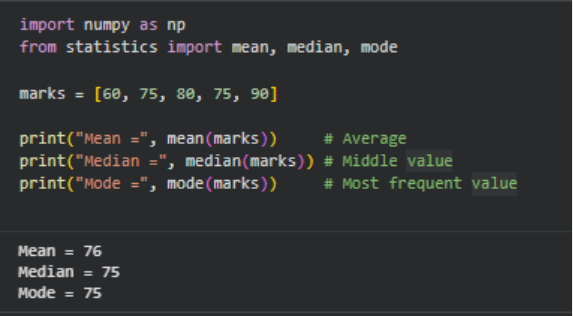
Output Meaning
- Mean → overall average
- Median → actual center value
- Mode → value repeated most
Example: 2. Correlation
Do Hours Studied and Marks Scored move together?
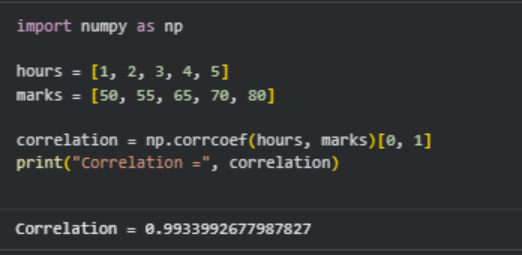
Output Meaning
- Close to +1 → strong positive relationship
- 0 → no relationship
- –1 → negative relationship
Example: 3. Probability
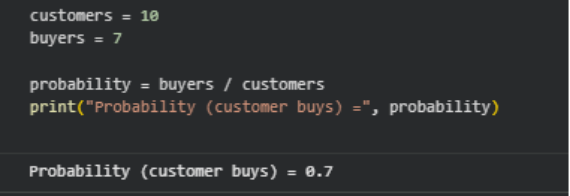
Output Meaning
Probability = 0.7 → 70% chance a customer buys.
Example: 4. Hypothesis Testing
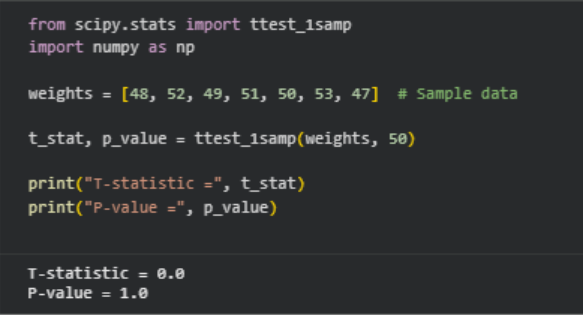
Output Meaning
- p-value < 0.05 → Significant difference
- p-value > 0.05 → No significant difference
The above will prove if your assumption (average = 50) is accurate or not.
concepts shown with plots
boxplot for mean/median
scatter plot for correlation
probability bar chart
distribution plot for hypothesis testing
MONTH 5 — Hands-On Projects
This is where you get ready for a job.
Examples:
- Analysis of sales trend
- Segmentation of customer base
- Recognition of market basket
- Insights on healthcare
- E-Commerce Dashboard
Why it matters
portfolio is stronger → An increase in the chances of interviews being offered.
MONTH 6+ — Job Preparation
You will be ready to:
- Create dashboards
- Analyze real datasets
- Present insights
- Apply for a role in data analysis
CONCLUSION
Becoming job-ready in Python for Data Analysis is completely possible even if you have no technical background. Through regular practice for 5-6 months, you will be able to create a powerful portfolio and will be ready to apply for data analyst positions with confidence.
Next Step – Explore Services with Craze Neurons
When we look at the path to growing our skills, career, or business, we find that it is not only about time or effort but about the ways in which we use guidance, tools, and experience. At Craze Neurons, we offer a set of services that can act as a lens into knowledge, performance, and opportunity. Through these offerings, we can see the depth of learning and the perspective that comes from practical engagement.
- Upskilling Training – We provide hands-on training in Data Science, Python, AI, and related fields. This is a way for us to look at learning from both practical and conceptual perspectives.
👉 Click here to know more: https://wa.me/918368195998?text=I%20want%20to%20Upskill%20with%20Craze%20Neurons - ATS-Friendly Resume – Our team can craft resumes that are optimized for Applicant Tracking Systems (ATS), highlighting skills, experiences, and achievements. This service is available at ₹599, providing a tangible way for us to make first impressions count.
👉 Click here to know more: https://wa.me/918368195998?text=I%20want%20an%20ATS-Friendly%20Resume%20from%20Craze%20Neurons - Web Development – We build responsive, SEO-friendly websites that can be a framework for growth. It is a way for us to put ideas into structure, visibility, and functionality.
👉 Click here to know more: https://wa.me/918368195998?text=I%20want%20a%20Website%20from%20Craze%20Neurons - Android Projects – These are real-time projects designed with the latest tech stack, allowing us to learn by doing. Guided mentorship gives us a chance to look at development from a practical lens and to understand the why behind each decision.
👉 Click here to know more: https://wa.me/918368195998?text=I%20want%20an%20Android%20Project%20with%20Guidance - Digital Marketing – We provide campaigns in SEO, social media, content, and email marketing, which can be used to see our brand’s reach and engagement from a deeper perspective.
👉 Click here to know more: https://wa.me/918368195998?text=I%20want%20Digital%20Marketing%20Support - Research Writing – We deliver plagiarism-free thesis, reports, and papers, which can help us explore knowledge, present ideas, and communicate insight with clarity.
👉 Click here to know more: https://wa.me/918368195998?text=I%20want%20Research%20Writing%20Support
In all these services, we can see that learning, building, promoting, or publishing is not just a task but a process of discovery. It is a way for us to understand, measure, and reflect on what is possible when guidance meets effort.
❓ Frequently Asked Questions (FAQs) – Craze Neurons Services
1. What is included in the Upskilling Training?
We provide hands-on training in Data Science, Python, AI, and allied fields. This allows us to work with concepts and projects, see practical applications, and explore the deeper understanding of each topic.
2. How does the ATS-Friendly Resume service work?
Our team crafts ATS-optimized resumes that highlight skills, experience, and achievements. This is a service priced at ₹599 and acts as a lens to make the first impression clear, measurable, and effective.
3. What kind of websites can Craze Neurons build?
We build responsive and SEO-friendly websites for businesses, personal portfolios, and e-commerce platforms. This enables us to translate ideas into structure, visibility, and functional design.
4. What are the Android Projects about?
We offer real-time Android projects with guided mentorship. This gives us an opportunity to learn by doing, understand development from multiple angles, and apply knowledge in a controlled, real-world context.
5. What does Digital Marketing service include?
Our service covers SEO, social media campaigns, content marketing, and email strategy, allowing us to look at brand growth quantitatively and qualitatively, understanding what works and why.
6. What type of Research Writing do you provide?
We provide plagiarism-free academic and professional content, including thesis, reports, and papers. This allows us to express ideas, support arguments, and explore knowledge with depth and precision.
7. How can I get started with Craze Neurons services?
We can begin by clicking the WhatsApp link for the service we are interested in. This lets us communicate directly with the team and explore the steps together.
8. Can I use multiple services together?
Yes, we can combine training, resume, web, Android, digital marketing, and research services. This allows us to see synergies, plan strategically, and use resources effectively.
9. Is the training suitable for beginners?
Absolutely. The courses are designed for learners at all levels. They allow us to progress step by step, integrate projects, and build confidence alongside skills.
10. How long does it take to complete a service or course?
Duration depends on the service. Training programs vary by course length. Projects may take a few weeks, while resume, website, or research work can often be completed within a few days. This helps us plan, manage, and achieve outcomes efficiently.
Stay Connected with Us
🌐 Website: www.crazeneurons.com
📢 Telegram: https://t.me/cenjob
📸 Instagram: https://www.instagram.com/crazeneurons
💼 LinkedIn: https://www.linkedin.com/company/crazeneurons
▶️ YouTube:https://www.youtube.com/@CrazeNeurons
📲 WhatsApp: +91 83681 95998