Python has become an indispensable tool for data analysis mainly caused by its simplicity, wide-ranging applications, and an abundant collection of open-source libraries. These tools are already accessible, and they allow the analyst to go through every step of analysis-from data cleaning and transformation to statistical modeling making and even stunning visualizations.
Introduction:
Data analysts today must work with not only large quantities of data but also very complex formats. However, with Python this is very simple since it can provide not only automation and fast processing but also the reliable analytical workflow which is far beyond what the traditional tools like Excel can offer. The actual power of Python is in its libraries, each dedicated to a specific section of the data analysis workflow. This guide is intended to present the most important libraries through simple examples that will even allow non-techies to understand their purpose.
Essential Python Libraries for Data Analysts
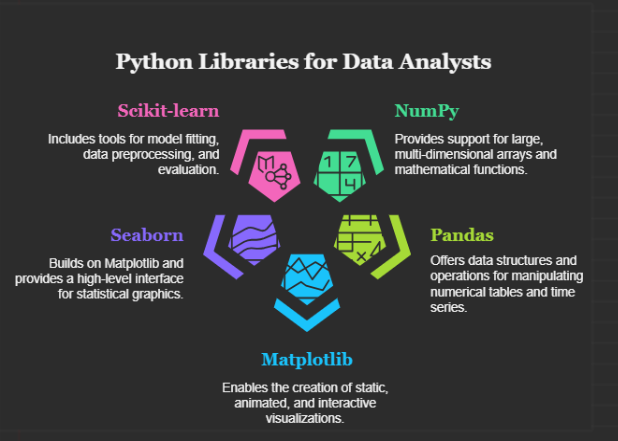
The following libraries form the backbone of the Python data analysis ecosystem.
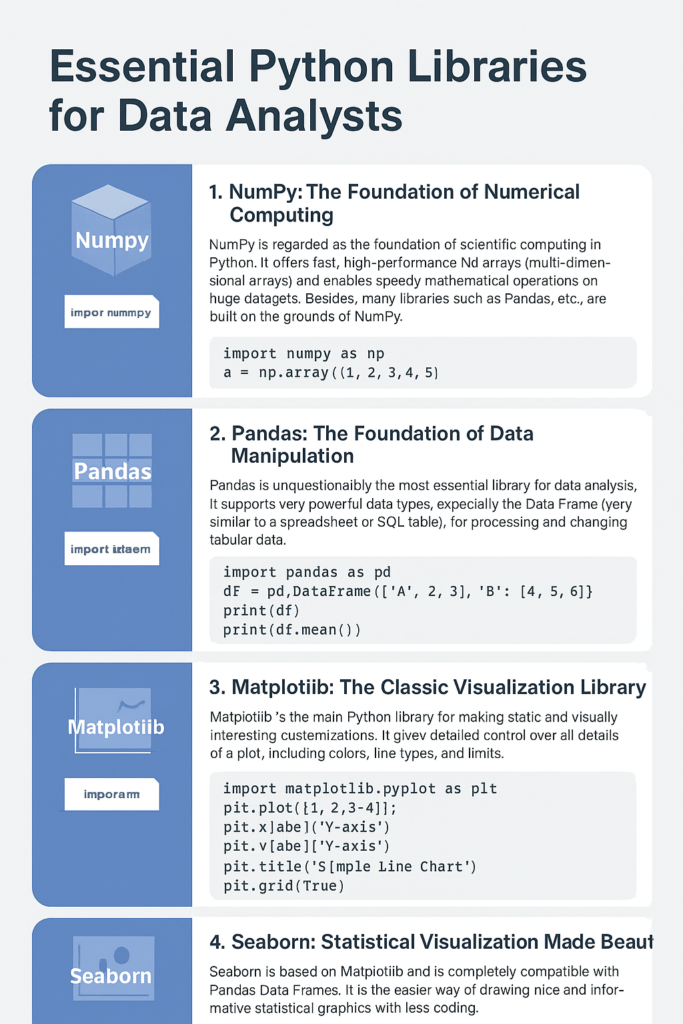
1. NumPy: The Foundation of Numerical Computing
NumPy is regarded as the foundation of scientific computing in Python. It offers fast, high-performance Nd arrays (multi-dimensional arrays) and enables speedy mathematical operations on huge datasets. Besides, many libraries such as Pandas, etc., are built on the grounds of NumPy.
What it’s best for:
- Numerical data storage and handling in a very efficient way.
- Executing rapid mathematical operations such as linear algebra, statistics, and random number generation.
Simple Code Example:
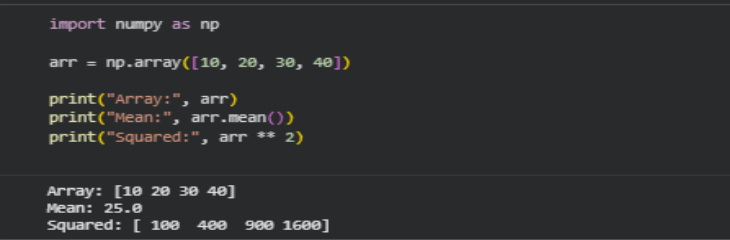
What this shows:
- How to create a NumPy array
- Fast mathematical operations
2. Pandas: The Foundation of Data Manipulation
Pandas are unquestionably the most essential library for data analysis. It supports very powerful data types, especially the Data Frame (very similar to a spreadsheet or SQL table), for processing and changing tabular data.
What it’s best for:
- Reading and writing data in different formats (CSV, Excel, SQL databases).
- Data cleaning, filtering, and transforming datasets.
- Grouping, joining, and merging data from multiple sources.
Simple Code Example:
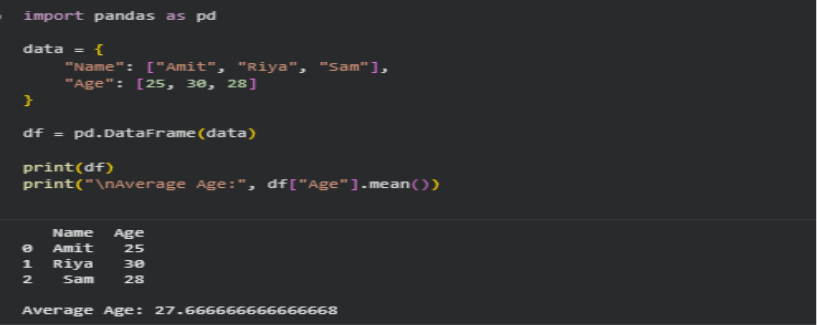
What this shows:
- Create a Data Frame
- View data like Excel
- Calculate statistics (mean)
3. Matplotlib: The Classic Visualization Library
Matplotlib is the main Python library for making static and visually interesting customizations. It gives detailed control over all details of a plot, including colors, line types, and axis limits.
What it’s best for:
- Creating a wide range of plots including line plots, scatter plots, histograms, and bar charts.
- Generating publication-quality figures and visualizations.
Simple Code Example:
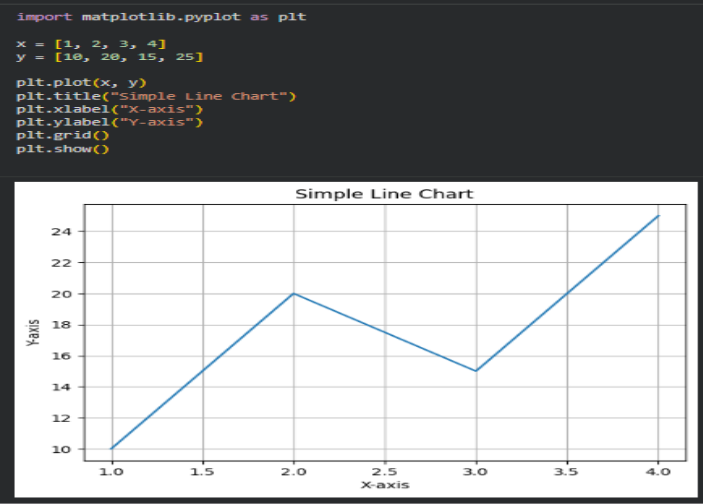
What this shows:
- Create a simple line chart
- Add labels, title, grid
4. Seaborn: Statistical Visualization Made Beautiful
Seaborn is based on Matplotlib and is completely compatible with Pandas Data Frames. It is the easier way of drawing nice and informative statistical graphics with less coding.
What it’s best for:
- Easy making of advanced statistical visualizations such as heatmaps, pair plots, and violin plots
- Fast and easy visualization of relations and distributions in data.
Simple Code Example:
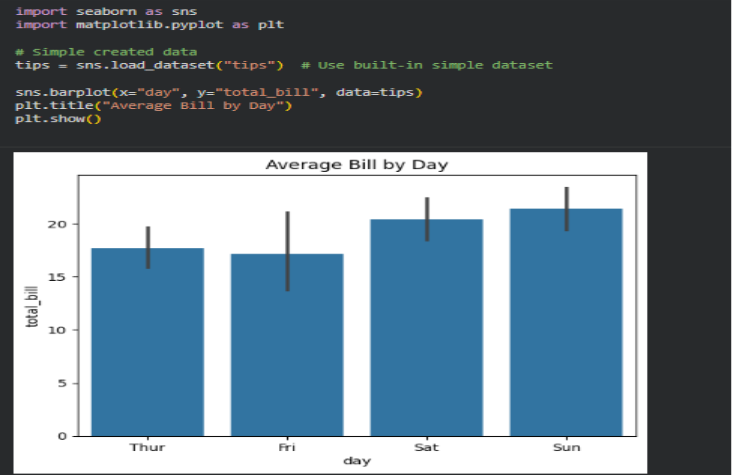
What this shows:
- Easy, beautiful statistical charts
- Automatically calculates averages
5. Scikit-learn: Machine Learning Simplified
Scikit-learn is a must-have tool for data analysts who are transitioning to predictive modeling. It provides a uniform API for many different machine learning techniques, and all of them are based on NumPy, SciPy, and Matplotlib.
What it’s best for:
- Tasks related to data mining and analysis.
- The application of classification, regression, and clustering methods is important.
- Model selection, assessment, and data processing.
Core Concept: Scikit-learn supports the development of models that perceive and exploit patterns in the data to predict new data.
Simple Code Example:
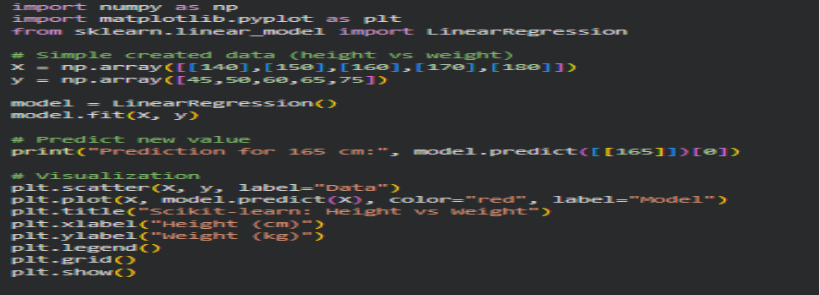
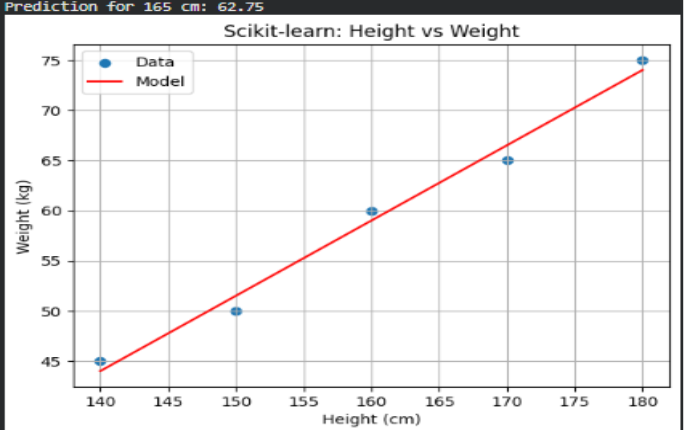
What this shows:
- Model learning a simple pattern
- Predicting new values
- Visualization of ML result
Conclusion
Getting proficient with these essential Python libraries—Pandas for data management, NumPy for numerical power, Matplotlib and Seaborn for graphical representation, and Scikit-learn for forecasting models—will very much enhance your data analytics capabilities. They are considered the gold standard for professional data analysts worldwide.
This conclusion connects naturally with earlier work that expands on Python’s role in modern analytics, including a detailed overview of its practical capabilities in Python for Data Analysis (https://crazeneurons.com/2025/11/16/python-for-data-analysis/) and its real-world impact on efficiency in How Python Changed My Work (https://crazeneurons.com/2025/11/17/how-python-changed-my-work-and-made-data-less-scary/). Readers who want broader context on industry developments can explore evolving trends in Future of Data Analytics (https://crazeneurons.com/2025/08/03/future-of-data-analytics-in-2025-top-trends-tools-career-skills-industry-insights/) and the growing importance of data literacy in Why Learning Data Skills Matters (https://crazeneurons.com/2025/08/02/why-learning-data-analysis-data-science-and-ai-matters-in-todays-world/). For additional technical depth, complementary discussions on Automation & Future of Jobs (https://crazeneurons.com/2025/08/20/what-is-automation-trends-future-and-impact-on-jobs/), Machine Learning Trends (https://crazeneurons.com/2025/11/02/top-machine-learning-trends-applications-algorithms-and-types-explained/), Text Preprocessing (https://crazeneurons.com/2025/10/30/handling-emojis-text-preprocessing-in-nlp/), and NLP with NLTK (https://crazeneurons.com/2025/10/28/natural-language-processing-nlp-with-nltk-sequence-analysis-real-life-examples/) offer further avenues for exploration.
Next Step – Explore Services with Craze Neurons
When we look at the path to growing our skills, career, or business, we find that it is not only about time or effort but about the ways in which we use guidance, tools, and experience. At Craze Neurons, we offer a set of services that can act as a lens into knowledge, performance, and opportunity. Through these offerings, we can see the depth of learning and the perspective that comes from practical engagement.
- Upskilling Training – We provide hands-on training in Data Science, Python, AI, and related fields. This is a way for us to look at learning from both practical and conceptual perspectives.
👉 Click here to know more: https://wa.me/918368195998?text=I%20want%20to%20Upskill%20with%20Craze%20Neurons - ATS-Friendly Resume – Our team can craft resumes that are optimized for Applicant Tracking Systems (ATS), highlighting skills, experiences, and achievements. This service is available at ₹599, providing a tangible way for us to make first impressions count.
👉 Click here to know more: https://wa.me/918368195998?text=I%20want%20an%20ATS-Friendly%20Resume%20from%20Craze%20Neurons - Web Development – We build responsive, SEO-friendly websites that can be a framework for growth. It is a way for us to put ideas into structure, visibility, and functionality.
👉 Click here to know more: https://wa.me/918368195998?text=I%20want%20a%20Website%20from%20Craze%20Neurons - Android Projects – These are real-time projects designed with the latest tech stack, allowing us to learn by doing. Guided mentorship gives us a chance to look at development from a practical lens and to understand the why behind each decision.
👉 Click here to know more: https://wa.me/918368195998?text=I%20want%20an%20Android%20Project%20with%20Guidance - Digital Marketing – We provide campaigns in SEO, social media, content, and email marketing, which can be used to see our brand’s reach and engagement from a deeper perspective.
👉 Click here to know more: https://wa.me/918368195998?text=I%20want%20Digital%20Marketing%20Support - Research Writing – We deliver plagiarism-free thesis, reports, and papers, which can help us explore knowledge, present ideas, and communicate insight with clarity.
👉 Click here to know more: https://wa.me/918368195998?text=I%20want%20Research%20Writing%20Support
In all these services, we can see that learning, building, promoting, or publishing is not just a task but a process of discovery. It is a way for us to understand, measure, and reflect on what is possible when guidance meets effort.
❓ Frequently Asked Questions (FAQs) – Craze Neurons Services
1. What is included in the Upskilling Training?
We provide hands-on training in Data Science, Python, AI, and allied fields. This allows us to work with concepts and projects, see practical applications, and explore the deeper understanding of each topic.
2. How does the ATS-Friendly Resume service work?
Our team crafts ATS-optimized resumes that highlight skills, experience, and achievements. This is a service priced at ₹599 and acts as a lens to make the first impression clear, measurable, and effective.
3. What kind of websites can Craze Neurons build?
We build responsive and SEO-friendly websites for businesses, personal portfolios, and e-commerce platforms. This enables us to translate ideas into structure, visibility, and functional design.
4. What are the Android Projects about?
We offer real-time Android projects with guided mentorship. This gives us an opportunity to learn by doing, understand development from multiple angles, and apply knowledge in a controlled, real-world context.
5. What does Digital Marketing service include?
Our service covers SEO, social media campaigns, content marketing, and email strategy, allowing us to look at brand growth quantitatively and qualitatively, understanding what works and why.
6. What type of Research Writing do you provide?
We provide plagiarism-free academic and professional content, including thesis, reports, and papers. This allows us to express ideas, support arguments, and explore knowledge with depth and precision.
7. How can I get started with Craze Neurons services?
We can begin by clicking the WhatsApp link for the service we are interested in. This lets us communicate directly with the team and explore the steps together.
8. Can I use multiple services together?
Yes, we can combine training, resume, web, Android, digital marketing, and research services. This allows us to see synergies, plan strategically, and use resources effectively.
9. Is the training suitable for beginners?
Absolutely. The courses are designed for learners at all levels. They allow us to progress step by step, integrate projects, and build confidence alongside skills.
10. How long does it take to complete a service or course?
Duration depends on the service. Training programs vary by course length. Projects may take a few weeks, while resume, website, or research work can often be completed within a few days. This helps us plan, manage, and achieve outcomes efficiently.
Stay Connected with Us
🌐 Website: www.crazeneurons.com
📢 Telegram: https://t.me/cenjob
📸 Instagram: https://www.instagram.com/crazeneurons
💼 LinkedIn: https://www.linkedin.com/company/crazeneurons
▶️ YouTube:https://www.youtube.com/@CrazeNeurons
📲 WhatsApp: +91 83681 95998