Introduction
Modern machine learning datasets often contain a large number of features or variables. While having more information can be beneficial, an excessive number of features can significantly reduce model efficiency. High-dimensional datasets increase computational cost, complicate analysis, and may lead to poor generalization of models.
This phenomenon is commonly known as the curse of dimensionality, where increasing dimensional space causes data points to become sparse and learning patterns becomes more difficult for machine learning algorithms.
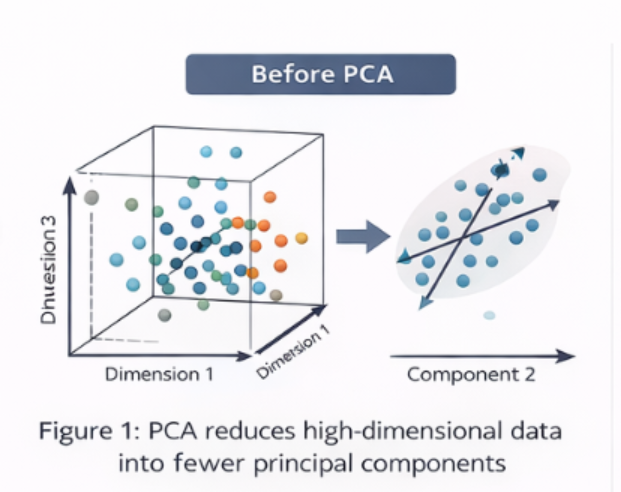
Principal Component Analysis (PCA) is one of the most widely used dimensionality reduction techniques in machine learning and data science. It transforms a large set of correlated variables into a smaller set of uncorrelated variables called principal components, while preserving most of the important information contained in the original dataset.
By simplifying complex datasets, PCA improves computational efficiency, reduces noise, and often enhances the performance of machine learning models.
What is Principal Component Analysis (PCA)?
Principal Component Analysis (PCA) is a statistical technique used to reduce the number of variables in a dataset while retaining the most significant patterns of information.
Instead of working with the original features, PCA creates new variables called principal components, which are combinations of the original variables.
These principal components have the following characteristics:
- They are linear combinations of the original features
- They capture the maximum variance in the data
- They are mutually uncorrelated (orthogonal)
In simple terms, PCA keeps the most informative patterns in the data while eliminating redundant or less useful information.
Why Dimensionality Reduction Matters in Machine Learning
High-dimensional datasets often create several challenges in machine learning and data analysis.
1. Increased Computational Cost
When datasets contain hundreds or thousands of features, training machine learning models becomes computationally expensive and time-consuming.
2. Risk of Overfitting
Too many features may cause models to memorize training data instead of learning meaningful patterns, resulting in poor performance on unseen data.
3. Difficult Data Visualization
Humans can easily interpret two or three dimensions, but visualizing datasets with dozens or hundreds of dimensions becomes nearly impossible.
4. Redundant Information
Many features may contain similar or correlated information, which does not contribute additional knowledge to the model.
5. Higher Storage Requirements
Large datasets require more storage and data management resources, increasing infrastructure costs.
Benefits of PCA
Using PCA helps address these problems by:
- Reducing the number of features
- Improving model training speed
- Minimizing overfitting
- Removing redundant information
- Enabling 2D or 3D visualization of complex datasets
- Reducing storage and processing costs
Understanding Variance in PCA
Variance measures how much the data points differ from the mean value of the dataset.
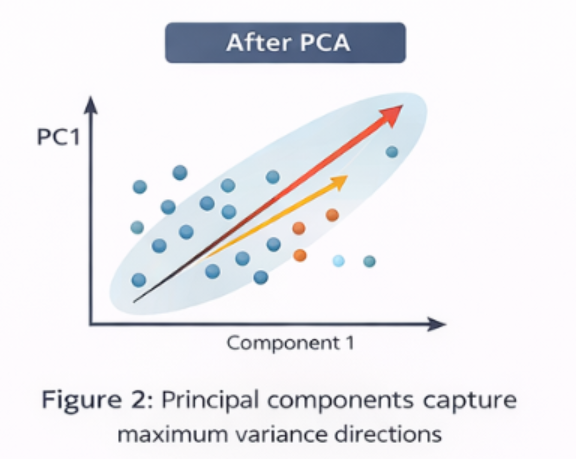
PCA identifies the directions in which the data varies the most. These directions form the principal components.
- First Principal Component (PC1) captures the maximum variance in the data.
- Second Principal Component (PC2) captures the second highest variance.
- Additional components follow the same pattern.
Each component explains a portion of the total variance present in the dataset.
Example
| Component | Variance Explained |
| PC1 | 52% |
| PC2 | 28% |
| PC3 | 12% |
In this example, the first two components explain 80% of the total information, meaning most of the dataset’s structure can be represented using only two components.
Covariance Matrix: Understanding Feature Relationships
Before computing principal components, PCA calculates the covariance matrix of the dataset.
The covariance matrix helps identify relationships between features by measuring how variables change together.
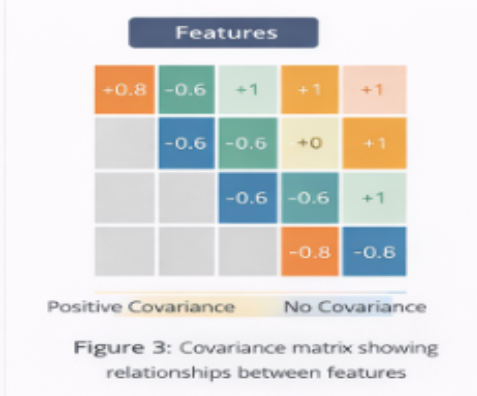
It shows:
- Whether two features increase or decrease together
- The strength of correlation between variables
- The direction of their relationship
If two features are highly correlated, they contain similar information. PCA combines such features into fewer principal components, reducing redundancy in the dataset.
In simple terms, the covariance matrix helps PCA identify where redundancy exists in the data.
Eigenvalues and Eigenvectors: Mathematical Foundation of PCA
The core mathematical concept behind PCA involves eigenvalues and eigenvectors, which are derived from the covariance matrix.
Eigenvectors
Eigenvectors represent the direction of the principal components. They define the new axes onto which the data is projected.
Eigenvalues
Eigenvalues represent the magnitude or importance of each eigenvector. They indicate how much variance is captured by each principal component.

In summary:
- Eigenvector → Direction of the component
- Eigenvalue → Importance (variance captured) of that direction
PCA ranks the components according to their eigenvalues, with higher eigenvalues indicating more informative components.
Scree Plot: Selecting the Optimal Number of Components
A scree plot is a graphical tool used to determine how many principal components should be retained.
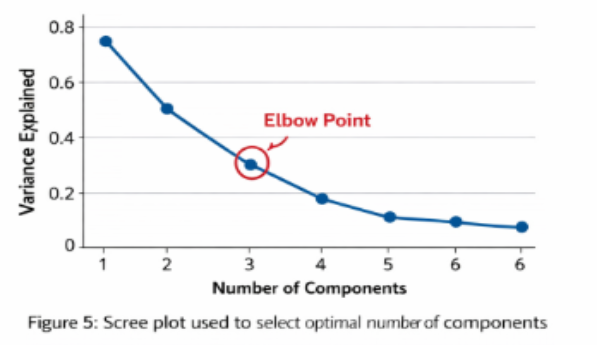
The scree plot displays:
- X-axis: Principal component number
- Y-axis: Eigenvalue or variance explained
Typically, components are selected until the curve begins to flatten, known as the elbow point.
This approach ensures that:
- Most of the useful information is preserved
- Unnecessary dimensions are eliminated
Steps Involved in PCA
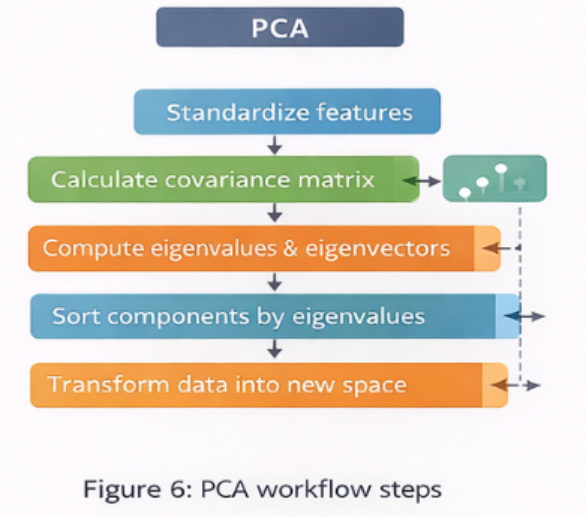
The standard workflow for applying PCA includes the following steps:
1. Standardize the Data
Features are scaled so that each variable contributes equally to the analysis.
2. Compute the Covariance Matrix
The covariance matrix identifies relationships between variables.
3. Calculate Eigenvalues and Eigenvectors
These values determine the principal components and their importance.
4. Sort Components by Eigenvalues
Components with higher eigenvalues are considered more informative.
5. Select the Top Components
Choose the components that capture the majority of the variance.
6. Transform the Dataset
Project the original data into the new lower-dimensional component space.
Applications of PCA in Machine Learning
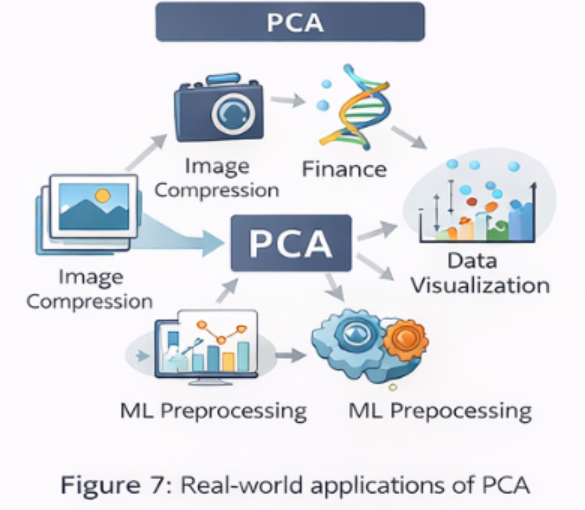
Principal Component Analysis is widely used across various fields.
Image Processing
PCA reduces image dimensions while preserving important visual patterns.
Finance
It helps analyze correlations between financial indicators and market variables.
Bioinformatics
PCA reduces thousands of gene expression variables into a manageable number of components.
Data Visualization
Complex multi-dimensional datasets can be visualized in two or three dimensions.
Machine Learning Preprocessing
PCA improves training efficiency and reduces the risk of overfitting.
Advantages of PCA
- Reduces dimensionality of datasets
- Handles multicollinearity between variables
- Speeds up machine learning algorithms
- Helps visualize high-dimensional data
- Reduces noise in the dataset
Limitations of PCA
Despite its advantages, PCA also has certain limitations:
- Principal components are often difficult to interpret
- PCA works only with linear relationships
- Some information may be lost during dimensionality reduction
- Results are sensitive to feature scaling
Conclusion
Principal Component Analysis (PCA) is a fundamental dimensionality reduction technique used in machine learning and data science. By transforming correlated features into a smaller set of uncorrelated principal components, PCA simplifies complex datasets while preserving their most important information.
This reduction not only improves computational efficiency but also enhances model performance by minimizing redundancy and reducing overfitting. Understanding concepts such as variance, covariance, eigenvalues, eigenvectors, and scree plots enables practitioners to apply PCA effectively in real-world machine learning applications.
As datasets continue to grow in size and complexity, PCA remains a powerful tool for making high-dimensional data more manageable and insightful.
For deeper context and practical extensions across AI, data science, automation, Python, careers, and industry trends, explore these related articles:
Your Next Step: Turn Learning Into Real Outcomes
Learning creates understanding. Progress comes from applying it with the right guidance. Use the table below to identify your immediate goal, understand what support fits best, and take a clear next step with Craze Neurons.
| What You Need Right Now! | What This Service Helps You Achieve | Starting At | Next Step |
| Upskilling Training | Real-world capability in Data Science, Python, AI, and related fields through hands-on training, live projects, mentorship, and strong conceptual grounding. | ₹2000 | 👉 Start upskilling |
| ATS-Friendly Resume | An ATS-optimized resume that reaches recruiters, built using skill-focused structuring and precise keyword optimization aligned with hiring systems. | ₹599 | 👉 Get an ATS-ready resume |
| Web Development | A responsive, SEO-friendly website designed for visibility and growth, using performance-driven design, clean structure, and search readiness. | ₹5000 | 👉Get Web site support |
| Android Projects | Practical Android development experience gained through real-time projects, guided mentorship, and clear explanations behind technical decisions. | ₹10000 | 👉 Get Android support |
| Digital Marketing | Increased brand visibility and engagement achieved through data-driven SEO, content strategy, social media, and email marketing campaigns. | ₹5000 | 👉 Get digital marketing support |
| Research Writing | Clear, plagiarism-free academic and technical writing delivered through structured, original research with academic integrity. | ₹5000 | 👉 Get research writing support |
❓ Frequently Asked Questions (FAQs) – Craze Neurons Services
0. Not sure which option fits your situation?
A short discussion is often enough to identify the most effective path. We help you clarify scope, effort, and outcomes before you commit.
👉 Talk to Craze Neurons on WhatsApp
1. What is included in the Upskilling Training?
We provide hands-on training in Data Science, Python, AI, and allied fields. This allows us to work with concepts and projects, see practical applications, and explore the deeper understanding of each topic.
2. How does the ATS-Friendly Resume service work?
Our team crafts ATS-optimized resumes that highlight skills, experience, and achievements. This is a service priced at ₹599 and acts as a lens to make the first impression clear, measurable, and effective.
3. What kind of websites can Craze Neurons build?
We build responsive and SEO-friendly websites for businesses, personal portfolios, and e-commerce platforms. This enables us to translate ideas into structure, visibility, and functional design.
4. What are the Android Projects about?
We offer real-time Android projects with guided mentorship. This gives us an opportunity to learn by doing, understand development from multiple angles, and apply knowledge in a controlled, real-world context.
5. What does Digital Marketing service include?
Our service covers SEO, social media campaigns, content marketing, and email strategy, allowing us to look at brand growth quantitatively and qualitatively, understanding what works and why.
6. What type of Research Writing do you provide?
We provide plagiarism-free academic and professional content, including thesis, reports, and papers. This allows us to express ideas, support arguments, and explore knowledge with depth and precision.
7. How can I get started with Craze Neurons services?
We can begin by clicking the WhatsApp link for the service we are interested in. This lets us communicate directly with the team and explore the steps together.
8. Can I use multiple services together?
Yes, we can combine training, resume, web, Android, digital marketing, and research services. This allows us to see synergies, plan strategically, and use resources effectively.
9. Is the training suitable for beginners?
Absolutely. The courses are designed for learners at all levels. They allow us to progress step by step, integrate projects, and build confidence alongside skills.
10. How long does it take to complete a service or course?
Duration depends on the service. Training programs vary by course length. Projects may take a few weeks, while resume, website, or research work can often be completed within a few days. This helps us plan, manage, and achieve outcomes efficiently.
Stay Connected with Us
🌐 Website 📢 Telegram 📸 Instagram 💼 LinkedIn ▶️ YouTube 📲 WhatsApp: +91 83681 95998