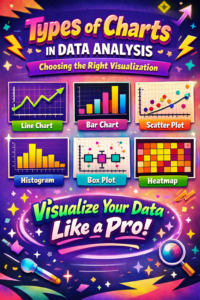
Selecting the Correct Visualization for Accurate Insights
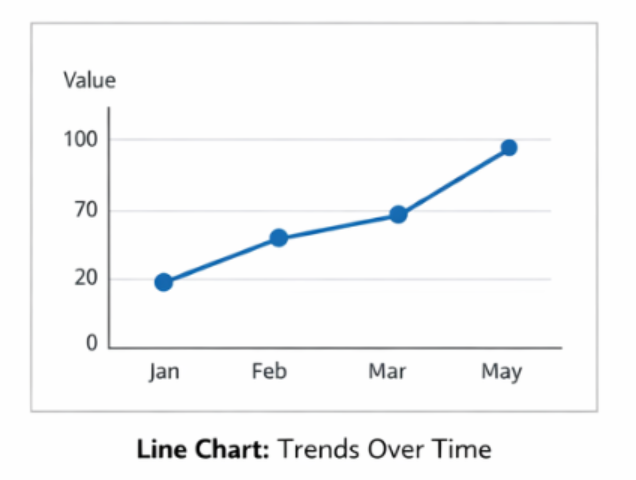
1. Line Charts
What It Is
A line chart displays data points connected by straight lines. It is primarily used to show how values evolve over time, allowing viewers to observe trends, fluctuations, and long-term movement.
Best Used When
- Tracking changes across a continuous time period
- Comparing how multiple variables evolve over time
- Observing growth patterns, declines, or seasonal variations
Common Use Cases
- Monthly or yearly sales performance
- Stock market price movements
- Website traffic trends
- Temperature variations across seasons
Why It Works
Line charts are particularly powerful for time-series data because they emphasize direction and continuity. By connecting values over time, they allow analysts to quickly identify upward or downward trends, sudden spikes, or cyclical behavior.
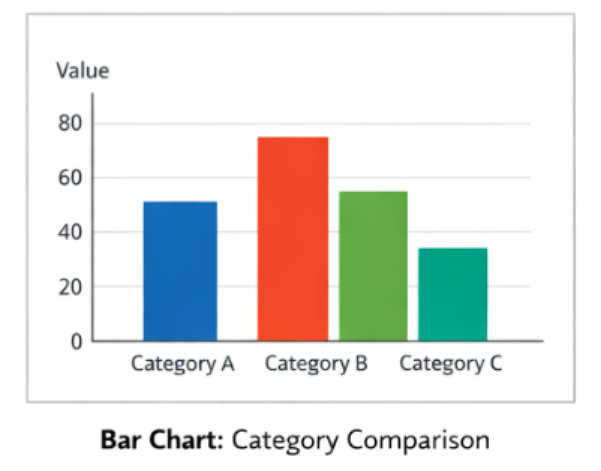
2. Bar Charts
What It Is
A bar chart uses rectangular bars to represent values across different categories. The length or height of each bar corresponds to the value it represents.
Best Used When
- Comparing values between discrete categories
- Ranking categories from highest to lowest
- Presenting frequency counts or aggregated values
Common Use Cases
- Sales by product category
- Revenue comparison across regions
- Employee distribution by department
- Survey response comparisons
Why It Works
Bar charts provide clear side-by-side comparisons, making differences between categories immediately visible. Because human perception easily compares lengths, this chart type is one of the most intuitive visualization tools.
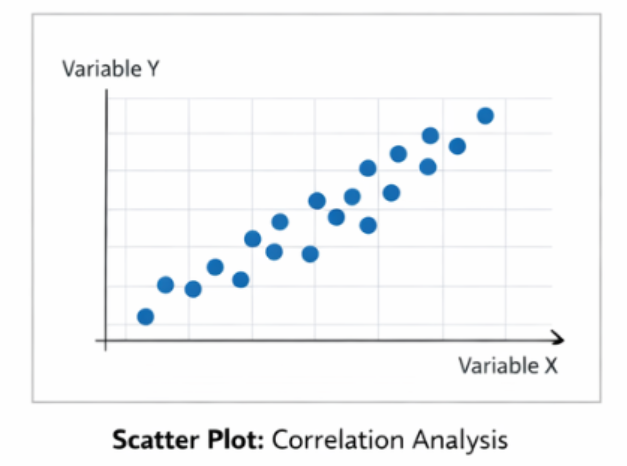
3. Scatter Plots
What It Is
A scatter plot represents individual observations as points on a two-dimensional graph. Each point corresponds to the value of two numerical variables.
Best Used When
- Investigating relationships between two variables
- Identifying correlations or dependencies
- Detecting clusters, patterns, or outliers in datasets
Common Use Cases
- Relationship between advertising spend and sales revenue
- Height versus weight analysis
- Impact of work experience on salary levels
- Feature relationships in machine learning datasets
Why It Works
Scatter plots visually reveal relationships and correlations that are difficult to detect in tables. They are widely used in statistical analysis and machine learning for exploratory data analysis and model validation.
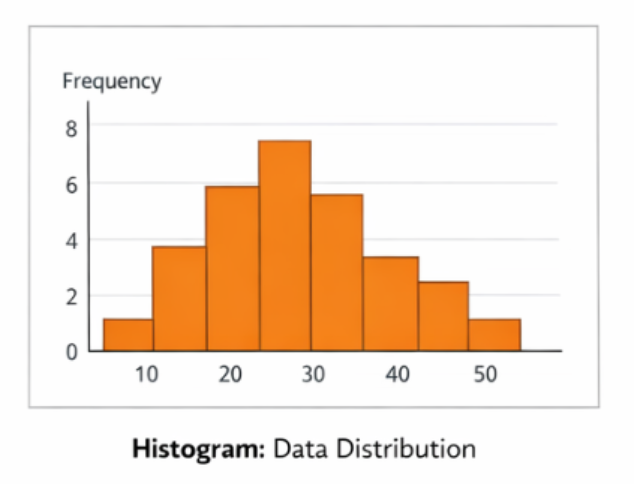
4. Histograms
What It Is
A histogram displays the distribution of continuous data by grouping values into intervals called bins. Each bin shows how many observations fall within a specific range.
Best Used When
- Understanding how data is distributed
- Identifying skewness or normal distribution patterns
- Detecting unusually high or low values
Common Use Cases
- Age distribution of customers
- Exam score distribution
- Salary ranges within an organization
- Transaction amount distribution
Why It Works
Histograms reveal the shape of the data distribution, allowing analysts to determine whether the data is symmetric, skewed, or concentrated within particular ranges. This makes them highly valuable for statistical analysis.
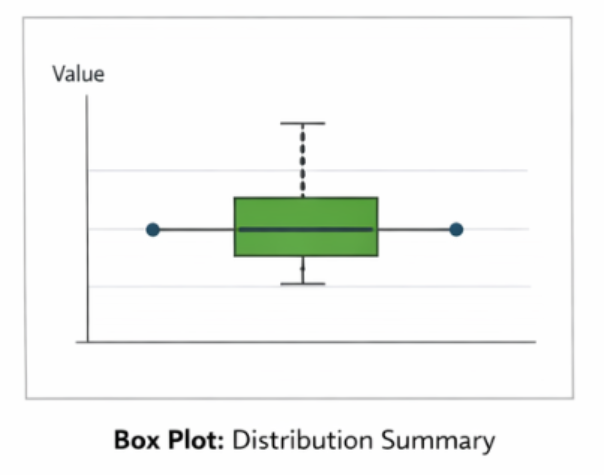
5. Box Plots (Box-and-Whisker Plots)
What It Is
A box plot summarizes a dataset using five key statistical values: minimum, first quartile, median, third quartile, and maximum. It also highlights potential outliers.
Best Used When
- Comparing distributions across multiple groups
- Identifying variability and spread within datasets
- Detecting outliers or extreme values
Common Use Cases
- Salary distribution across departments
- Performance comparison between teams
- Exam score comparisons across classes
Why It Works
Box plots provide a compact statistical summary of data. They allow analysts to compare multiple datasets quickly while highlighting central tendency, variability, and anomalies.
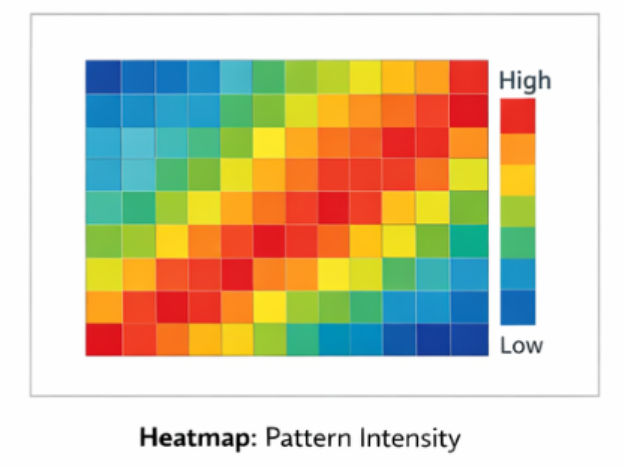
6. Heatmaps
What It Is
A heatmap represents data values using color intensity within a matrix or table structure. Higher values typically appear as darker or warmer colors.
Best Used When
- Identifying patterns across multiple variables
- Comparing values based on magnitude or intensity
- Quickly scanning large datasets for trends
Common Use Cases
- Correlation matrices in statistical analysis
- Website user interaction patterns
- Sales performance by region and time period
- Attendance or activity tracking
Why It Works
Heatmaps leverage color gradients to reveal patterns instantly. The human brain recognizes color intensity faster than numerical values, making heatmaps effective for highlighting high-impact areas and hidden relationships.
Choosing the Right Chart Matters
Each visualization type serves a specific analytical purpose. Selecting the appropriate chart helps ensure that insights are communicated clearly and accurately.
| Analysis Goal | Recommended Chart |
| Trend over time | Line Chart |
| Category comparison | Bar Chart |
| Relationship analysis | Scatter Plot |
| Distribution analysis | Histogram |
| Outlier detection | Box Plot |
| Pattern intensity | Heatmap |
Using the correct visualization provides several advantages:
- Clearer presentation of information
- Reduced risk of misinterpretation
- More effective data-driven decision making
- Stronger storytelling through data
Conclusion
Effective data analysis involves not only identifying insights but also communicating them clearly. Visualization bridges the gap between raw data and human understanding. By selecting the appropriate chart type, analysts can reveal patterns, highlight relationships, and make complex information accessible.
When used thoughtfully, charts transform datasets into compelling visual narratives that support informed decisions and deeper analytical understanding.
For deeper context and practical extensions across AI, data science, automation, Python, careers, and industry trends, explore these related articles:
Your Next Step: Turn Learning Into Real Outcomes
Learning creates understanding. Progress comes from applying it with the right guidance. Use the table below to identify your immediate goal, understand what support fits best, and take a clear next step with Craze Neurons.
| What You Need Right Now! | What This Service Helps You Achieve | Starting At | Next Step |
| Upskilling Training | Real-world capability in Data Science, Python, AI, and related fields through hands-on training, live projects, mentorship, and strong conceptual grounding. | ₹2000 | 👉 Start upskilling |
| ATS-Friendly Resume | An ATS-optimized resume that reaches recruiters, built using skill-focused structuring and precise keyword optimization aligned with hiring systems. | ₹599 | 👉 Get an ATS-ready resume |
| Web Development | A responsive, SEO-friendly website designed for visibility and growth, using performance-driven design, clean structure, and search readiness. | ₹5000 | 👉Get Web site support |
| Android Projects | Practical Android development experience gained through real-time projects, guided mentorship, and clear explanations behind technical decisions. | ₹10000 | 👉 Get Android support |
| Digital Marketing | Increased brand visibility and engagement achieved through data-driven SEO, content strategy, social media, and email marketing campaigns. | ₹5000 | 👉 Get digital marketing support |
| Research Writing | Clear, plagiarism-free academic and technical writing delivered through structured, original research with academic integrity. | ₹5000 | 👉 Get research writing support |
❓ Frequently Asked Questions (FAQs) – Craze Neurons Services
0. Not sure which option fits your situation?
A short discussion is often enough to identify the most effective path. We help you clarify scope, effort, and outcomes before you commit.
👉 Talk to Craze Neurons on WhatsApp
1. What is included in the Upskilling Training?
We provide hands-on training in Data Science, Python, AI, and allied fields. This allows us to work with concepts and projects, see practical applications, and explore the deeper understanding of each topic.
2. How does the ATS-Friendly Resume service work?
Our team crafts ATS-optimized resumes that highlight skills, experience, and achievements. This is a service priced at ₹599 and acts as a lens to make the first impression clear, measurable, and effective.
3. What kind of websites can Craze Neurons build?
We build responsive and SEO-friendly websites for businesses, personal portfolios, and e-commerce platforms. This enables us to translate ideas into structure, visibility, and functional design.
4. What are the Android Projects about?
We offer real-time Android projects with guided mentorship. This gives us an opportunity to learn by doing, understand development from multiple angles, and apply knowledge in a controlled, real-world context.
5. What does Digital Marketing service include?
Our service covers SEO, social media campaigns, content marketing, and email strategy, allowing us to look at brand growth quantitatively and qualitatively, understanding what works and why.
6. What type of Research Writing do you provide?
We provide plagiarism-free academic and professional content, including thesis, reports, and papers. This allows us to express ideas, support arguments, and explore knowledge with depth and precision.
7. How can I get started with Craze Neurons services?
We can begin by clicking the WhatsApp link for the service we are interested in. This lets us communicate directly with the team and explore the steps together.
8. Can I use multiple services together?
Yes, we can combine training, resume, web, Android, digital marketing, and research services. This allows us to see synergies, plan strategically, and use resources effectively.
9. Is the training suitable for beginners?
Absolutely. The courses are designed for learners at all levels. They allow us to progress step by step, integrate projects, and build confidence alongside skills.
10. How long does it take to complete a service or course?
Duration depends on the service. Training programs vary by course length. Projects may take a few weeks, while resume, website, or research work can often be completed within a few days. This helps us plan, manage, and achieve outcomes efficiently.
Stay Connected with Us
🌐 Website 📢 Telegram 📸 Instagram 💼 LinkedIn ▶️ YouTube 📲 WhatsApp: +91 83681 95998