Predicting Continuous Outcomes with Precision
Introduction
Regression algorithms help identify relationships between variables so we can predict continuous values such as prices, sales, or temperatures. One of the most widely used techniques in predictive modeling is regression. The primary function of regression algorithms is to establish variable relationships which they use to forecast continuous results including prices and sales and temperatures and risk scores.
Data analysts and data scientists need to understand different regression models because this knowledge enables them to select appropriate methods for solving actual problems.
This blog will examine the main regression types which machine learning employs, and we will learn when to use each regression method.
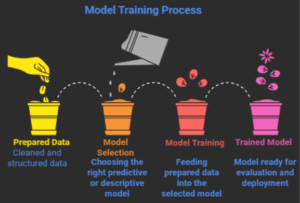
What is Regression in Machine Learning?
Regression is a supervised learning technique used to predict continuous numerical values based on one or more input variables.
The base function of regression serves to answer various inquiries which include:
- What will the house price be next year?
- How will sales change based on advertising spending?
- What is the expected temperature tomorrow?
Regression models work by learning the relationship between variables and using that relationship to make predictions.
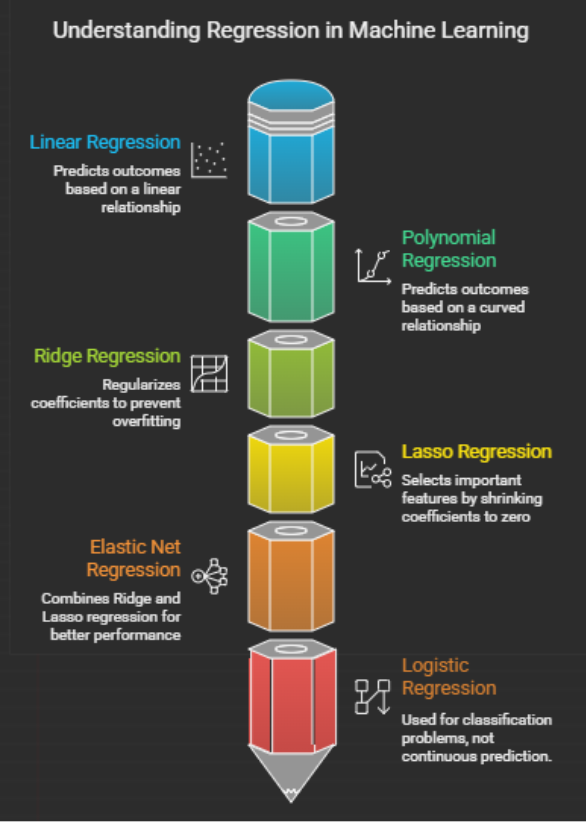
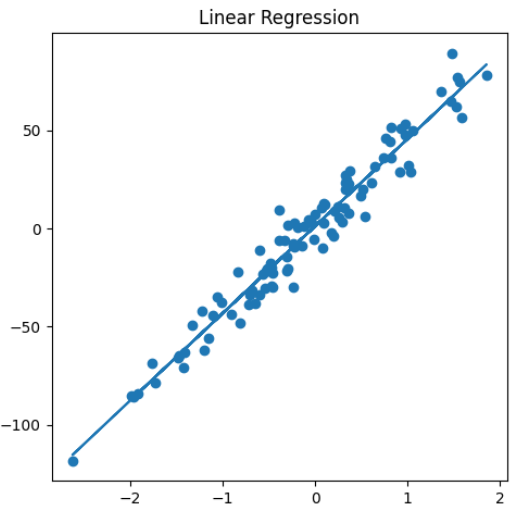
1. Linear Regression
Linear regression is one of the simplest and most widely used regression techniques. The method assumes a linear connection between input variables and output variables.
The model fits a straight line through the data points.
Linear Regression Formula
The mathematical relationship between variables shows the following expression for output prediction which uses input features and two coefficients together with an error term:
y = β₀ + β₁ x + ε
The formula contains the following elements:
- y = predicted output
- x = input feature
- β₀ = intercept
- β₁ = slope coefficient
- ε = error term
Example
House prices prediction uses three factors:
- house size
- number of rooms
- location score
Advantages
- The model is easy to understand interpretation.
- The model requires minimal time for training.
- The model performs effectively when handling linear connections.
Limitations
- The model cannot model intricate relationships between data.
- The model shows high sensitivity to data points that deviate from normal patterns.
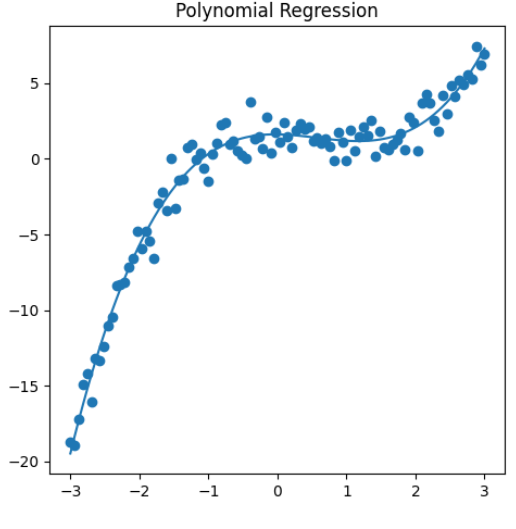
2. Polynomial Regression
The method of polynomial regression becomes essential when two variables demonstrate a non-linear connection.
The model establishes a curved line through the data points instead of using a straight line.
Polynomial Regression Formula
The formula establishes the equation y as the sum of the base term combined with the first term which depends on x and the second term which uses x² and the third term which uses x³ and continuing terms, and the error term epsilon.
The system uses this feature to develop intricate models which explain how different elements interact with each other.
Example
The process involves forecasting employee productivity throughout different periods, where productivity starts to grow before dropping down because of exhaustion.
Advantages
- The model detects intricate patterns existing within the data.
- The model helps us create various modeling techniques.
Limitations
- The model needs more extensive data to achieve accurate results.
- The results become harder to understand because of their increased complexity.
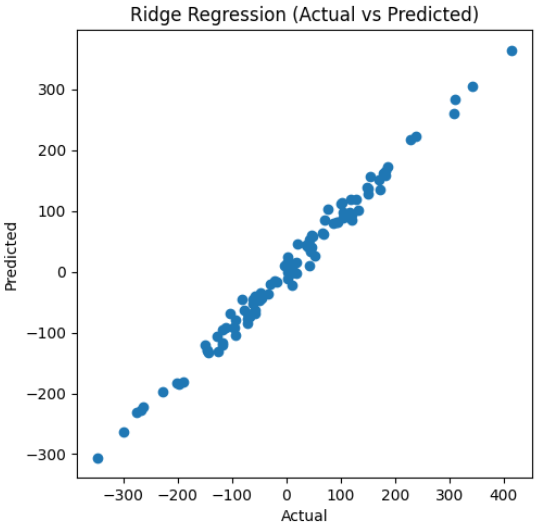
3. Ridge Regression
Ridge regression functions as a modified form of linear regression which implements regularization to stop excessive model development.
The system introduces a penalty component which decreases the size of the model coefficients.
Ridge Regression Formula
The equation represents the sum of squared differences between actual values and predicted values with a penalty term applied to all model parameters.
Where:
- λ (lambda) controls the strength of the penalty.
When to Use Ridge Regression
- The situation applies when the dataset contains numerous features.
- The situation occurs when two or more features show high correlations with each other.
Example
Stock price predictions require the usage of multiple financial indicators for accurate forecasting purposes.
4. Lasso Regression
Lasso regression represents a second regularization technique which simultaneously selects essential features from a dataset.
The technique allows for coefficient reduction until specific coefficients reach zero value, which results in complete removal of nonessential features.
Lasso Regression Formula
min ∑ (yᵢ – ŷᵢ)² + λ ∑ |βⱼ|
Advantages
- The method decreases overfitting problems.
- The method identifies critical features without the need for human intervention.
Example
Customer spending prediction uses multiple demographic variables for its analysis.
5. Elastic Net Regression
Elastic Net combines the strengths of Ridge and Lasso regression.
It uses both L1 and L2 for regularization of penalties.
Elastic Net Formula
min ∑ (yᵢ – ŷᵢ)² + λ₁ ∑ |βⱼ| + λ₂ ∑ βⱼ²
Advantages
- Handles multicollinearity
- Performs feature selection
- Works well with high-dimensional datasets
Example
Predicting genetic disease risk using thousands of medical variables.
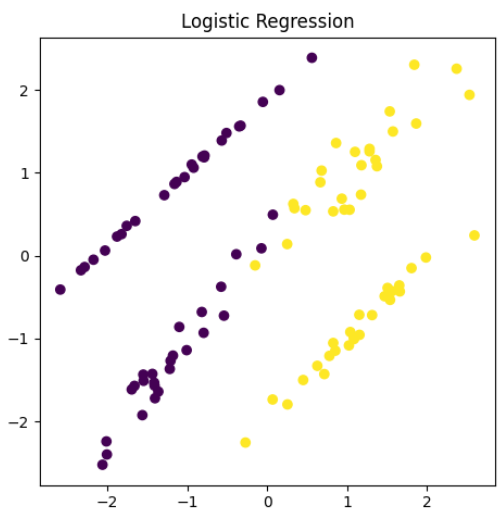
6. Logistic Regression (Classification Boundary)
The term regression describes logistic regression although its main function serves classification tasks.
The model predicts class membership probabilities instead of providing continuous value outputs.
Logistic Function
The equation P(y=1|x) = 1 / (1 + e^-(β₀ + β₁ x)) describes the relationship between two variables.
The model produces outputs that fall within the range of 0 to 1 which indicates the likelihood of an event occurring.
Example
The task involves determining whether an email qualifies as spam or non-spam.
Advantages
- The method maintains a straightforward design which helps us understand its functions.
- The model performs well for binary classification problems.
Code:
# Import libraries
import numpy as np
import matplotlib.pyplot as plt
from sklearn.linear_model import LinearRegression, Ridge, Lasso, ElasticNet, LogisticRegression
from sklearn.preprocessing import PolynomialFeatures
from sklearn.pipeline import make_pipeline
from sklearn.datasets import make_regression, make_classification
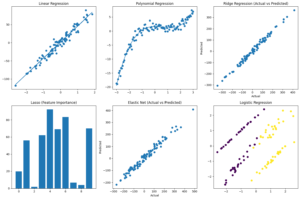
# Create subplot grid (2 rows × 3 columns)
fig, axes = plt.subplots(2, 3, figsize=(15, 10))
# ——————————-
# 1. Linear Regression
# ——————————-
X_lin, y_lin = make_regression(n_samples=100, n_features=1, noise=10, random_state=42)
lin_model = LinearRegression()
lin_model.fit(X_lin, y_lin)
y_pred_lin = lin_model.predict(X_lin)
axes[0, 0].scatter(X_lin, y_lin)
axes[0, 0].plot(X_lin, y_pred_lin)
axes[0, 0].set_title(“Linear Regression”)
# ——————————-
# 2. Polynomial Regression
# ——————————-
np.random.seed(0)
X_poly = np.linspace(-3, 3, 100).reshape(-1, 1)
y_poly = 0.5 * X_poly**3 – X_poly**2 + 2 + np.random.randn(100, 1)
poly_model = make_pipeline(PolynomialFeatures(degree=3), LinearRegression())
poly_model.fit(X_poly, y_poly)
y_pred_poly = poly_model.predict(X_poly)
axes[0, 1].scatter(X_poly, y_poly)
axes[0, 1].plot(X_poly, y_pred_poly)
axes[0, 1].set_title(“Polynomial Regression”)
# ——————————-
# 3. Ridge Regression
# ——————————-
X_ridge, y_ridge = make_regression(n_samples=100, n_features=5, noise=15, random_state=42)
ridge_model = Ridge(alpha=10)
ridge_model.fit(X_ridge, y_ridge)
y_pred_ridge = ridge_model.predict(X_ridge)
axes[0, 2].scatter(y_ridge, y_pred_ridge)
axes[0, 2].set_title(“Ridge Regression (Actual vs Predicted)”)
axes[0, 2].set_xlabel(“Actual”)
axes[0, 2].set_ylabel(“Predicted”)
# ——————————-
# 4. Lasso Regression
# ——————————-
X_lasso, y_lasso = make_regression(n_samples=100, n_features=10, noise=20, random_state=42)
lasso_model = Lasso(alpha=0.5)
lasso_model.fit(X_lasso, y_lasso)
axes[1, 0].bar(range(len(lasso_model.coef_)), lasso_model.coef_)
axes[1, 0].set_title(“Lasso (Feature Importance)”)
# ——————————-
# 5. Elastic Net Regression
# ——————————-
X_elastic, y_elastic = make_regression(n_samples=100, n_features=8, noise=25, random_state=42)
elastic_model = ElasticNet(alpha=0.5, l1_ratio=0.5)
elastic_model.fit(X_elastic, y_elastic)
y_pred_elastic = elastic_model.predict(X_elastic)
axes[1, 1].scatter(y_elastic, y_pred_elastic)
axes[1, 1].set_title(“Elastic Net (Actual vs Predicted)”)
axes[1, 1].set_xlabel(“Actual”)
axes[1, 1].set_ylabel(“Predicted”)
# ——————————-
# 6. Logistic Regression
# ——————————-
X_log, y_log = make_classification(n_samples=100, n_features=2, n_redundant=0, random_state=42)
log_model = LogisticRegression()
log_model.fit(X_log, y_log)
axes[1, 2].scatter(X_log[:, 0], X_log[:, 1], c=y_log)
axes[1, 2].set_title(“Logistic Regression”)
# Adjust layout
plt.tight_layout()
plt.show()

When to Use Each Regression Type
| Regression Type | Best Used When |
| Linear Regression | Relationship between variables is linear |
| Polynomial Regression | Relationship exists through a path which bends or shows non-linear behavior |
| Ridge Regression | Dataset contains multiple features which show strong correlation |
| Lasso Regression | The situation needs feature selection to be done |
| Elastic Net | The method combines the advantages of Ridge and Lasso |
| Logistic Regression | The model predicts the likelihood of each class for given data points |
Why Regression is Important in Machine Learning
Organizations use regression models because these models help organizations to:
- Forecast future trends
- Understand relationships between variables
- Support business decision-making
- Build predictive systems
Applications include:
- Real estate price prediction
- Sales forecasting
- Medical risk prediction
- Financial analysis
Conclusion
Regression techniques function as essential machine learning tools which enable prediction and analysis of numerical results. The different regression methods range from basic linear regression to complex regularized models which include Ridge, Lasso, and Elastic Net, and each method offers distinct advantages.
The appropriate regression model selection requires assessment of data characteristics and relationship patterns and specific problem requirements.
Data scientists and analysts can create better predictive models through their understanding of various regression types.
For deeper context and practical extensions across AI, data science, automation, Python, careers, and industry trends, explore these related articles:
Your Next Step: Turn Learning Into Real Outcomes
Learning creates understanding. Progress comes from applying it with the right guidance. Use the table below to identify your immediate goal, understand what support fits best, and take a clear next step with Craze Neurons.
| What You Need Right Now! | What This Service Helps You Achieve | Starting At | Next Step |
| Upskilling Training | Real-world capability in Data Science, Python, AI, and related fields through hands-on training, live projects, mentorship, and strong conceptual grounding. | ₹2000 | 👉 Start upskilling |
| ATS-Friendly Resume | An ATS-optimized resume that reaches recruiters, built using skill-focused structuring and precise keyword optimization aligned with hiring systems. | ₹599 | 👉 Get an ATS-ready resume |
| Web Development | A responsive, SEO-friendly website designed for visibility and growth, using performance-driven design, clean structure, and search readiness. | ₹5000 | 👉Get Web site support |
| Android Projects | Practical Android development experience gained through real-time projects, guided mentorship, and clear explanations behind technical decisions. | ₹10000 | 👉 Get Android support |
| Digital Marketing | Increased brand visibility and engagement achieved through data-driven SEO, content strategy, social media, and email marketing campaigns. | ₹5000 | 👉 Get digital marketing support |
| Research Writing | Clear, plagiarism-free academic and technical writing delivered through structured, original research with academic integrity. | ₹5000 | 👉 Get research writing support |
❓ Frequently Asked Questions (FAQs) – Craze Neurons Services
0. Not sure which option fits your situation?
A short discussion is often enough to identify the most effective path. We help you clarify scope, effort, and outcomes before you commit.
👉 Talk to Craze Neurons on WhatsApp
1. What is included in the Upskilling Training?
We provide hands-on training in Data Science, Python, AI, and allied fields. This allows us to work with concepts and projects, see practical applications, and explore the deeper understanding of each topic.
2. How does the ATS-Friendly Resume service work?
Our team crafts ATS-optimized resumes that highlight skills, experience, and achievements. This is a service priced at ₹599 and acts as a lens to make the first impression clear, measurable, and effective.
3. What kind of websites can Craze Neurons build?
We build responsive and SEO-friendly websites for businesses, personal portfolios, and e-commerce platforms. This enables us to translate ideas into structure, visibility, and functional design.
4. What are the Android Projects about?
We offer real-time Android projects with guided mentorship. This gives us an opportunity to learn by doing, understand development from multiple angles, and apply knowledge in a controlled, real-world context.
5. What does Digital Marketing service include?
Our service covers SEO, social media campaigns, content marketing, and email strategy, allowing us to look at brand growth quantitatively and qualitatively, understanding what works and why.
6. What type of Research Writing do you provide?
We provide plagiarism-free academic and professional content, including thesis, reports, and papers. This allows us to express ideas, support arguments, and explore knowledge with depth and precision.
7. How can I get started with Craze Neurons services?
We can begin by clicking the WhatsApp link for the service we are interested in. This lets us communicate directly with the team and explore the steps together.
8. Can I use multiple services together?
Yes, we can combine training, resume, web, Android, digital marketing, and research services. This allows us to see synergies, plan strategically, and use resources effectively.
9. Is the training suitable for beginners?
Absolutely. The courses are designed for learners at all levels. They allow us to progress step by step, integrate projects, and build confidence alongside skills.
10. How long does it take to complete a service or course?
Duration depends on the service. Training programs vary by course length. Projects may take a few weeks, while resume, website, or research work can often be completed within a few days. This helps us plan, manage, and achieve outcomes efficiently.
Stay Connected with Us
🌐 Website 📢 Telegram 📸 Instagram 💼 LinkedIn ▶️ YouTube 📲 WhatsApp: +91 83681 95998