Master clustering in machine learning with a step-by-step guide covering K-Means, Hierarchical Clustering, DBSCAN, Gaussian Mixture Models (GMM), evaluation metrics, practical examples, and real-world applications
What Is Clustering in Machine Learning?
Clustering in Machine Learning is an unsupervised learning technique that groups similar data points into clusters based on their characteristics or patterns. Unlike supervised learning, clustering does not require labeled data. The algorithm automatically identifies hidden structures within a dataset, where objects in the same cluster are more similar to each other than to those in other clusters.
For example, an e-commerce company can use clustering to group customers based on their purchasing behavior, allowing it to create personalized marketing campaigns for different customer segments.
Some key Features of Clustering are:
- Works with unlabeled data.
- Groups similar data into clusters.
- Helps discover hidden patterns and relationships.
- Widely used in data mining, machine learning, and data analysis.
Why Is Clustering Important?
Clustering plays a crucial role in data analysis because it simplifies large datasets by organizing similar data into meaningful groups. This enables organizations to gain valuable insights, improve decision-making, and identify trends that may not be visible in raw data.
Benefits of Clustering are
- Pattern Discovery: Reveals hidden patterns and relationships in data.
- Customer Segmentation: Groups customers based on behavior, preferences, or demographics.
- Anomaly Detection: Identifies unusual or fraudulent activities.
- Data Simplification: Reduces data complexity for easier analysis.
- Recommendation Systems: Helps recommend products, movies, or music based on user similarities.
- Image Segmentation: Separates different objects or regions in digital images.
- Healthcare Analysis: Groups patients with similar symptoms for better diagnosis and treatment.
Because of these advantages, clustering is widely used in industries such as healthcare, finance, marketing, cybersecurity, retail, and social media.
How Clustering Works
Clustering works by measuring the similarity or distance between data points and grouping those with similar characteristics into the same cluster. The objective is to maximize similarity within a cluster while minimizing similarity between different clusters.
Step-by-Step Process
- Collect Data: Gather the dataset containing the features to be analyzed.
- Preprocess the Data: Clean missing values, remove duplicates, and normalize or standardize the data if necessary.
- Choose a Clustering Algorithm: Select an appropriate algorithm such as K-Means, Hierarchical Clustering, DBSCAN, or Gaussian Mixture Model (GMM) based on the dataset and problem.
- Calculate Similarity: The algorithm measures the distance or similarity between data points using metrics such as Euclidean distance, Manhattan distance, or Cosine similarity.
- Form Clusters: Data points with similar characteristics are grouped together into clusters.
- Evaluate the Results: Assess the quality of the clusters using evaluation metrics such as the Silhouette Score, Davies–Bouldin Index, or Elbow Method.
Example: Suppose an online shopping company has customer data containing Age, Annual Income, and Shopping Score. A clustering algorithm can automatically divide customers into groups such as:
- High-income, high-spending customers
- High-income, low-spending customers
- Low-income, frequent shoppers
- Budget-conscious customers
The company can then design targeted marketing strategies for each customer group, improving customer satisfaction and sales.
Types of Clustering Techniques

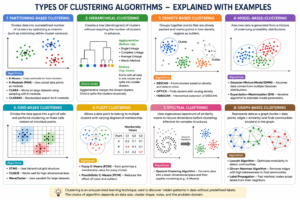
1. Partitioning-Based Clustering
Partitioning-based clustering divides a dataset into a fixed number of non-overlapping clusters. Each data point belongs to only one cluster, and the goal is to maximize similarity within clusters while minimizing similarity between them.
• K-Means: The most popular clustering algorithm that partitions data into K clusters using the nearest centroid. It is fast and works well for large datasets.
• K-Medoids (PAM): Similar to K-Means, but uses actual data points (medoids) as cluster centers instead of the mean. It is more robust to noise and outliers.
• CLARA (Clustering Large Applications): An improved version of K-Medoids designed for large datasets. It performs clustering on random samples to reduce computation time.
• CLARANS (Clustering Large Applications based on Randomized Search): A randomized version of K-Medoids that searches for better cluster centers more efficiently than CLARA.
2. Hierarchical Clustering
Hierarchical clustering creates a tree-like structure called a dendrogram, showing relationships between clusters. It does not require the number of clusters to be specified beforehand.
A. Agglomerative Clustering (Bottom-Up): Starts with each data point as an individual cluster and repeatedly merges the closest clusters until only one cluster remains.
• Single Linkage: Merges clusters based on the minimum distance between any two data points.
• Complete Linkage: Merges clusters based on the maximum distance between data points.
• Average Linkage: Uses the average distance between all pairs of data points in two clusters.
• Ward’s Method: Merges clusters that result in the smallest increase in within-cluster variance, producing compact clusters.
B. Divisive Clustering (Top-Down): Starts with all data points in one cluster and repeatedly splits them into smaller clusters.
3. Density-Based Clustering
Density-based clustering groups data points that are closely packed together and identifies isolated points as noise or outliers.
• DBSCAN: Forms clusters based on data density and automatically detects outliers without requiring the number of clusters.
• OPTICS: An extension of DBSCAN that can identify clusters with different densities more effectively.
• HDBSCAN: A hierarchical version of DBSCAN that automatically determines the best clusters and handles varying densities.
4. Model-Based Clustering
Model-based clustering assumes that data is generated from a statistical model and groups data according to probability distributions.
• Gaussian Mixture Model (GMM): Represents data as a mixture of Gaussian distributions, allowing a data point to belong to multiple clusters with different probabilities.
• Expectation-Maximization (EM):An iterative optimization algorithm used to estimate the parameters of models like GMM for accurate clustering.
5. Grid-Based Clustering
Grid-based clustering divides the data space into a grid of cells and performs clustering on these cells instead of individual data points, making it efficient for large datasets.
• STING: Uses a hierarchical grid structure to cluster spatial data quickly and efficiently.
• CLIQUE: A grid-based algorithm that finds clusters in high-dimensional datasets by identifying dense regions.
• WaveCluster: Uses wavelet transforms to detect clusters and remove noise from large spatial datasets.
6. Fuzzy Clustering
Unlike traditional clustering, fuzzy clustering allows a data point to belong to multiple clusters with different membership values.
• Fuzzy C-Means (FCM):Assigns each data point a membership score for every cluster instead of placing it in a single cluster.
• Possibilistic C-Means (PCM): An improved version of FCM that reduces the influence of noise and outliers by assigning independent membership values.
7. Spectral Clustering
Spectral clustering uses graph theory and eigenvalues of a similarity matrix to identify clusters. It is effective for datasets with complex or non-spherical shapes.
• Spectral Clustering Algorithm: Transforms data into a lower-dimensional space using eigenvectors and then applies clustering methods such as K-Means.
8. Graph-Based Clustering
Graph-based clustering represents data as a graph where nodes are data points and edges represent similarities. Clusters are detected by analyzing graph connectivity.
• Louvain Algorithm: Detects communities in large networks by maximizing modularity. It is widely used in social network analysis.
• Girvan-Newman Algorithm: Identifies communities by repeatedly removing edges with the highest betweenness centrality.
• Label Propagation: A fast community detection algorithm where nodes iteratively adopt the labels of their neighboring nodes until stable clusters are formed.
Summary Table
| Clustering Type | Main Idea | Common Algorithms |
| Partitioning-Based | Divides data into a fixed number of clusters | K-Means, K-Medoids, CLARA, CLARANS |
| Hierarchical | Builds a hierarchy of clusters | Agglomerative, Divisive |
| Density-Based | Groups dense regions and detects outliers | DBSCAN, OPTICS, HDBSCAN |
| Model-Based | Uses probability models for clustering | GMM, EM |
| Grid-Based | Divides the data space into grids | STING, CLIQUE, WaveCluster |
| Fuzzy | Allows data points to belong to multiple clusters | FCM, PCM |
| Spectral | Uses graph theory and eigenvalues | Spectral Clustering |
| Graph-Based | Finds communities in graph-structured data | Louvain, Girvan-Newman, Label Propagation |
Comparison of Clustering Algorithms
Different clustering algorithms are designed for different types of datasets. Some work best for large datasets, while others are more effective at handling noise, irregular cluster shapes, or overlapping data. The choice of algorithm depends on the nature of the data and the clustering objective.
| Algorithm | Cluster Shape | Handles Outliers | Requires Number of Clusters | Best For |
| K-Means | Spherical | No | Yes | Large datasets with well-separated clusters |
| Hierarchical Clustering | Any | Limited | No | Small to medium datasets and relationship analysis |
| DBSCAN | Arbitrary | Yes | No | Datasets with noise and irregular-shaped clusters |
| Gaussian Mixture Model (GMM) | Elliptical | Moderate | Yes | Overlapping clusters and probabilistic clustering |
| Fuzzy C-Means (FCM) | Flexible | Moderate | Yes | Data belonging to multiple clusters |
| Spectral Clustering | Complex | Limited | Yes | Non-linear and graph-based datasets |
Key Differences
- K-Means is fast and efficient but struggles with outliers.
- Hierarchical Clustering provides a dendrogram and does not require a predefined number of clusters.
- DBSCAN automatically detects clusters and identifies noise.
- GMM allows a data point to belong to multiple clusters with different probabilities.
- Fuzzy C-Means supports partial membership in multiple clusters.
- Spectral Clustering performs well on complex datasets where traditional methods fail.
Advantages of Clustering
Clustering is one of the most widely used unsupervised learning techniques because it helps uncover hidden patterns in data without requiring labeled examples.
Advantages
- Discovers hidden patterns and relationships in data.
- Works effectively with unlabeled datasets.
- Simplifies large and complex datasets.
- Supports customer segmentation and personalized marketing.
- Detects anomalies and fraudulent activities.
- Improves recommendation systems.
- Assists in image segmentation and computer vision.
- Helps researchers analyze biological and medical data.
- Can be applied across multiple industries, including healthcare, finance, retail, and cybersecurity.
Limitations of Clustering
Although clustering is a powerful technique, it also has several limitations that should be considered before selecting an algorithm.
Limitations
- Choosing the appropriate clustering algorithm can be challenging.
- Some algorithms require the number of clusters to be specified in advance.
- Sensitive to noisy data and outliers.
- Results depend on feature selection and data preprocessing.
- Different algorithms may produce different clustering results for the same dataset.
- High computational cost for very large datasets in some methods.
- Difficult to evaluate clustering accuracy without labeled data.
Real-World Applications of Clustering
Clustering is widely used across industries to organize data, identify patterns, and support decision-making.
1. Customer Segmentation: Businesses group customers based on purchasing behavior to create personalized marketing campaigns.
2. Recommendation Systems: Streaming platforms and e-commerce websites recommend products, movies, or music by clustering users with similar preferences.
3. Image Segmentation: Clustering separates objects and regions within digital images, improving image analysis and computer vision tasks.
4. Healthcare: Hospitals cluster patients with similar symptoms or medical histories to improve diagnosis and treatment planning.
5. Fraud Detection: Banks and financial institutions identify unusual transaction patterns that may indicate fraudulent activities.
6. Social Network Analysis: Social media platforms detect communities of users with similar interests or interactions.
7. Document Classification: Search engines and digital libraries organize documents into meaningful topic groups.
8. Bioinformatics: Researchers cluster genes and proteins to study biological functions and disease relationships.
9. Market Basket Analysis: Retailers analyze purchasing patterns to identify products that are frequently bought together.
10. Geographic Information Systems (GIS): Clustering helps identify hotspots such as accident-prone areas, disease outbreaks, or crime locations.
Frequently Asked Questions (FAQs)
1. What is clustering in machine learning?
Clustering is an unsupervised learning technique that groups similar data points into clusters based on shared characteristics.
2. What is the difference between clustering and classification?
Clustering works with unlabeled data, while classification requires labeled data to predict predefined categories.
3. Which clustering algorithm is most commonly used?
K-Means is the most widely used clustering algorithm because it is simple, fast, and efficient for large datasets.
4. Which clustering algorithm handles outliers best?
DBSCAN is highly effective at identifying and separating outliers from clusters.
5. What is a centroid in K-Means?
A centroid is the central point of a cluster, calculated as the mean of all data points within that cluster.
6. What is a dendrogram?
A dendrogram is a tree-like diagram used in hierarchical clustering to visualize how clusters are formed.
7. Can a data point belong to multiple clusters?
Yes. In Gaussian Mixture Models (GMM) and Fuzzy C-Means (FCM), a data point can belong to multiple clusters with different probabilities or membership values.
8. What are the main applications of clustering?
Clustering is used in customer segmentation, recommendation systems, image processing, healthcare, fraud detection, document organization, and bioinformatics.
9. Is clustering supervised or unsupervised learning?
Clustering is an unsupervised learning technique because it does not require labeled training data.
10. Which clustering algorithm should I choose?
- K-Means: Large datasets with well-separated clusters.
- Hierarchical Clustering: Small datasets and relationship analysis.
- DBSCAN: Noisy datasets with irregular cluster shapes.
- GMM: Overlapping clusters.
- FCM: Data with partial cluster membership.
Conclusion
Clustering is a fundamental unsupervised machine learning technique used to group similar data points and discover hidden patterns in unlabeled datasets. It plays a crucial role in data mining, artificial intelligence, business analytics, healthcare, finance, and many other domains.
Several clustering algorithms are available, each designed for different types of data. K-Means is ideal for large datasets with well-defined clusters, Hierarchical Clustering reveals relationships through a dendrogram, DBSCAN effectively handles noise and irregular cluster shapes, and Gaussian Mixture Models (GMM) support probabilistic clustering for overlapping data. Advanced methods such as Fuzzy C-Means, Spectral Clustering, and Graph-Based Clustering further expand the range of applications.
Selecting the appropriate clustering algorithm depends on factors such as dataset size, cluster shape, presence of outliers, and computational requirements. By understanding the strengths and limitations of each approach, students, researchers, and practitioners can apply clustering effectively to solve real-world problems in customer segmentation, recommendation systems, fraud detection, image analysis, healthcare, and scientific research.
For deeper context and practical extensions across AI, data science, automation, Python, careers, and industry trends, explore these related articles:
Your Next Step: Turn Learning Into Real Outcomes
Learning creates understanding. Progress comes from applying it with the right guidance. Use the table below to identify your immediate goal, understand what support fits best, and take a clear next step with Craze Neurons.
| What You Need Right Now! | What This Service Helps You Achieve | Starting At | Next Step |
| Upskilling Training | Real-world capability in Data Science, Python, AI, and related fields through hands-on training, live projects, mentorship, and strong conceptual grounding. | ₹2000 | 👉 Start upskilling |
| ATS-Friendly Resume | An ATS-optimized resume that reaches recruiters, built using skill-focused structuring and precise keyword optimization aligned with hiring systems. | ₹599 | 👉 Get an ATS-ready resume |
| Web Development | A responsive, SEO-friendly website designed for visibility and growth, using performance-driven design, clean structure, and search readiness. | ₹5000 | 👉Get Web site support |
| Android Projects | Practical Android development experience gained through real-time projects, guided mentorship, and clear explanations behind technical decisions. | ₹10000 | 👉 Get Android support |
| Digital Marketing | Increased brand visibility and engagement achieved through data-driven SEO, content strategy, social media, and email marketing campaigns. | ₹5000 | 👉 Get digital marketing support |
| Research Writing | Clear, plagiarism-free academic and technical writing delivered through structured, original research with academic integrity. | ₹5000 | 👉 Get research writing support |
❓ Frequently Asked Questions (FAQs) – Craze Neurons Services
0. Not sure which option fits your situation?
A short discussion is often enough to identify the most effective path. We help you clarify scope, effort, and outcomes before you commit.
👉 Talk to Craze Neurons on WhatsApp
1. What is included in the Upskilling Training?
We provide hands-on training in Data Science, Python, AI, and allied fields. This allows us to work with concepts and projects, see practical applications, and explore the deeper understanding of each topic.
2. How does the ATS-Friendly Resume service work?
Our team crafts ATS-optimized resumes that highlight skills, experience, and achievements. This is a service priced at ₹599 and acts as a lens to make the first impression clear, measurable, and effective.
3. What kind of websites can Craze Neurons build?
We build responsive and SEO-friendly websites for businesses, personal portfolios, and e-commerce platforms. This enables us to translate ideas into structure, visibility, and functional design.
4. What are the Android Projects about?
We offer real-time Android projects with guided mentorship. This gives us an opportunity to learn by doing, understand development from multiple angles, and apply knowledge in a controlled, real-world context.
5. What does Digital Marketing service include?
Our service covers SEO, social media campaigns, content marketing, and email strategy, allowing us to look at brand growth quantitatively and qualitatively, understanding what works and why.
6. What type of Research Writing do you provide?
We provide plagiarism-free academic and professional content, including thesis, reports, and papers. This allows us to express ideas, support arguments, and explore knowledge with depth and precision.
7. How can I get started with Craze Neurons services?
We can begin by clicking the WhatsApp link for the service we are interested in. This lets us communicate directly with the team and explore the steps together.
8. Can I use multiple services together?
Yes, we can combine training, resume, web, Android, digital marketing, and research services. This allows us to see synergies, plan strategically, and use resources effectively.
9. Is the training suitable for beginners?
Absolutely. The courses are designed for learners at all levels. They allow us to progress step by step, integrate projects, and build confidence alongside skills.
10. How long does it take to complete a service or course?
Duration depends on the service. Training programs vary by course length. Projects may take a few weeks, while resume, website, or research work can often be completed within a few days. This helps us plan, manage, and achieve outcomes efficiently.
Stay Connected with Us
🌐 Website 📢 Telegram 📸 Instagram 💼 LinkedIn ▶️ YouTube 📲 WhatsApp: +91 83681 95998