Structured Roadmap from Raw Data to Insights
Introduction
Solving problems in data science involves more than just building models. It follows a structured process that converts raw data into useful insights. The analytical process flow provides a structured way to analyze data.
This framework helps analysts move from understanding problems to implementing solutions. The process includes multiple steps that ensure accurate and reliable results while delivering real business value.
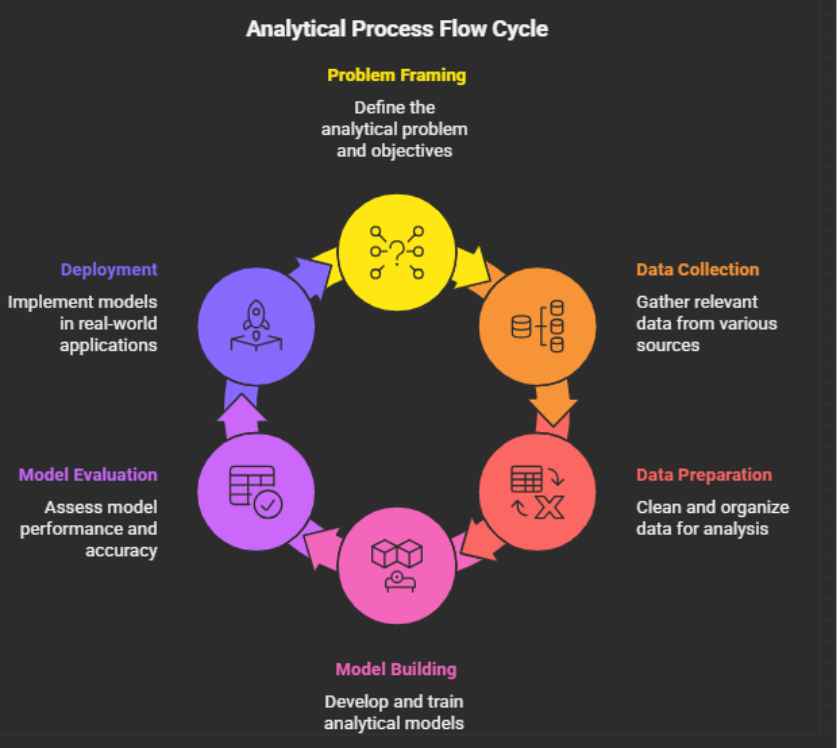
This article explains the complete analytical process flow, including problem understanding, data collection, data cleaning, model building, evaluation, deployment, and feedback.
1. Problem Framing
The initial and essential task of data science begins with problem framing. The process establishes the required solution for the problem together with the methods used to evaluate successful completion.
Key Activities
- Understanding business objectives
- Defining research questions
- Identifying target variables
- Setting success metrics
Example: A company wants to predict customer churn. The problem is framed as “Predict which customers are likely to leave the service.”
Why It Matters: Clear problem definition prevents incorrect analysis and saves time.
2. Data Collection
After defining the problem, relevant data must be gathered from different sources.
The data sources include:
- Databases
- APIs
- Surveys
- Sensors
- Web scraping
- Business records
Types of Data
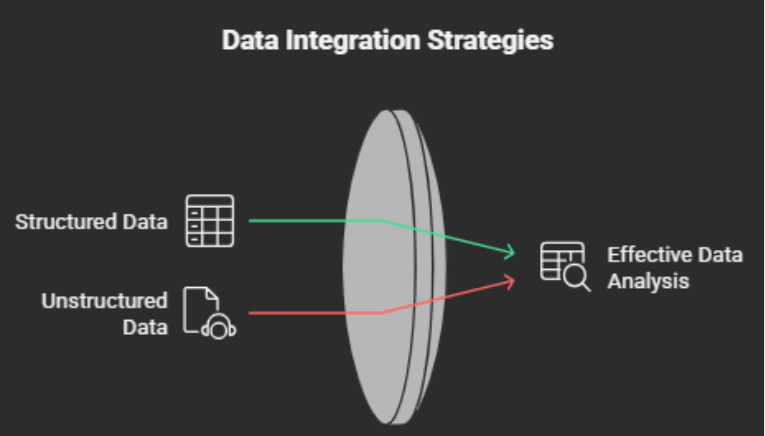
- Structured data (tables, spreadsheets)
- Unstructured data (text, images)
- Semi-structured data (JSON, XML)
Why It Matters: Better data leads to better insights and model performance.
3. Data Cleaning and Preparation
Raw data contains errors along with missing values and inconsistencies. Data cleaning improves data quality before analysis of work begins.
Key Tasks
- Handling missing values
- Removing duplicates
- Correcting errors
- Feature transformation
- Data normalization and scaling
Example: Missing values get replaced by mean or median values.
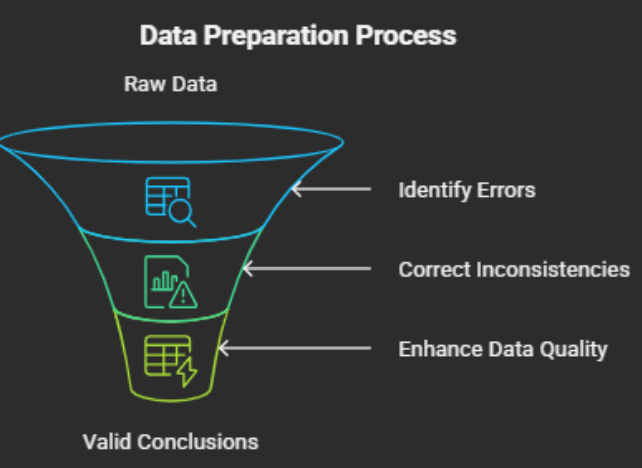
Why It Matters: Clean data improves model accuracy and reliability.
4. Exploratory Data Analysis (EDA)
Exploratory Data Analysis helps researchers identify data patterns and relationships and data trends.
Techniques Used
- Statistical summaries
- Data visualization
- Correlation analysis
- Outlier detection
Common Tools
- Histograms
- Box plots
- Scatter plots
Why It Matters: EDA helps discover insights and guides model selection.
5. Feature Engineering
Feature Engineering improves model performance by transforming processed data into better data which machine learning algorithms use as input.
The current step aims to boost predictive accuracy while data cleaning focuses on removing errors from data.
Example: Creating a new feature such as “Customer Tenure” from registration date can improve churn prediction performance.
Why It Matters
- Strong features allow even simple models to perform effectively.
- Better features directly improve prediction accuracy and model stability.
Feature Engineering – Key Activities
(Making Data Smarter for the Model)
| Activity | What It Means | Why It Is Needed | Example |
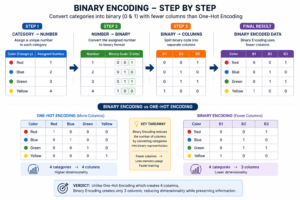
| Encoding Categorical Variables | Converting text categories into numbers | ML models understand only numbers | Male/Female → 0/1 |
| Scaling / Normalization | Bringing features to similar scale | Required for distance-based models (KNN, SVM, Logistic Regression) | Salary in lakhs & Age in years scaled to same range |
| Feature Creation | Creating new meaningful variables from existing data | Improves model prediction power | Age from Date of Birth |
| Feature Selection | Removing irrelevant or less important features | Reduces overfitting & improves speed | Removing ID column |
| Handling Multicollinearity | Removing highly correlated features | Prevents unstable regression coefficients | Removing one of two highly correlated variables |
| Feature Transformation | Applying mathematical changes (log, sqrt) | Makes skewed data more normal | Log transformation for income |
| Dimensionality Reduction (PCA) | Reducing number of features while keeping important information | Useful for large feature sets | Reducing 50 features to 10 |
6. Model Building
The researchers create machine learning or statistical models which they use to address the existing problem.
Model Categories with Algorithms
1️⃣ Regression Models (Predict Continuous / Numerical Values)
| Algorithm | Function (What it Does) | Example |
| Linear Regression | Models’ linear relationship between variables | Predict house price |
| Ridge / Lasso | Linear regression with regularization to reduce overfitting | Sales forecasting |
| Decision Tree Regressor | Splits data into decision rules | Predict salary |
| Random Forest Regressor | Combines multiple trees for better accuracy | Demand prediction |
| Support Vector Regressor (SVR) | Fits best boundary line with margin | Stock trend prediction |
2️⃣ Classification Models (Predict Categories / Classes)
| Algorithm | Function (What it Does) | Example |
| Logistic Regression | Predicts probability of a class | Spam detection |
| Decision Tree Classifier | Rule-based classification | Loan approval |
| Random Forest Classifier | Multiple trees voting system | Fraud detection |
| K-Nearest Neighbors (KNN) | Classifies based on nearest data points | Customer category prediction |
| Support Vector Machine (SVM) | Finds best boundary between classes | Image classification |
| Naive Bayes | Probability-based classification | Email filtering |
| Neural Network (ANN) | Learns complex patterns | Face recognition |
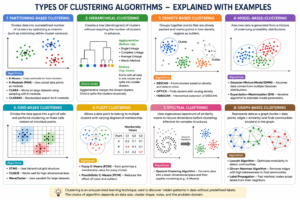
3️⃣ Clustering (No Target Variable – Groups Similar Data)
| Algorithm | Function (What it Does) | Example |
| K-Means | Divides data into K clusters | Customer segmentation |
| Hierarchical Clustering | Creates tree-like clusters | Market grouping |
| DBSCAN | Forms clusters based on density | Detect fraud patterns |
| Gaussian Mixture Model | Probabilistic clustering | User behavior grouping |
Process
- The team starts with algorithm selection
- They proceed to model training
- The next step involves choosing relevant features
- They conduct hyperparameter optimization
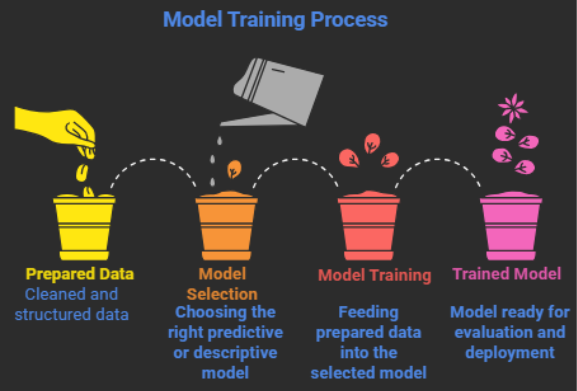
Why It Matters:
Models use data to detect patterns and create predictions about future events.
7. Model Evaluation
We evaluate the model to make sure it is accurate and reliable.
Each model type has its own evaluation method. See the table below.
1️⃣ Classification Evaluation Metrics
| Metric | Function (What it Measures) | Used For |
| Accuracy | Overall correct predictions | When classes are balanced |
| Precision | Correct positive predictions out of predicted positives | When false positives are costly (Fraud detection) |
| Recall | Correct positive predictions out of actual positives | When missing positives is risky (Disease detection) |
| F1-Score | Balance between Precision & Recall | When dataset is imbalanced |
| Confusion Matrix | Shows TP, FP, TN, FN breakdown | To understand detailed errors |
| ROC-AUC | Measures model’s ability to separate classes | Binary classification performance comparison |
2️⃣ Regression Evaluation Metrics
| Metric | Function (What it Measures) | Used For | Example |
| MAE | Average absolute error | Easy interpretation of error | If MAE = 2000, house price predictions are off by ₹2000 on average |
| MSE | Average squared error | Penalizes large errors | Large mistakes (₹50,000 error) increase MSE significantly |
| RMSE | Square root of MSE (error in original unit) | When you want error in actual unit | RMSE = ₹3000 means prediction error is around ₹3000 |
| R² Score | Percentage of variance explained | Overall model performance strength | R² = 0.85 means model explains 85% of price variation |
3️⃣ Clustering Evaluation Metrics
| Metric | Function (What it Measures) | Used For |
| Silhouette Score | Measures how similar a point is to its own cluster vs other clusters | To check cluster quality |
| Inertia (WCSS) | Measures within-cluster distance | Used in K-Means optimization |
| Davies-Bouldin Index | Measures cluster separation (lower is better) | Evaluate cluster compactness |
| Calinski-Harabasz Index | Ratio of between-cluster and within-cluster variance | Compare clustering models |
Validation Methods
- Train-test split
- Cross-validation
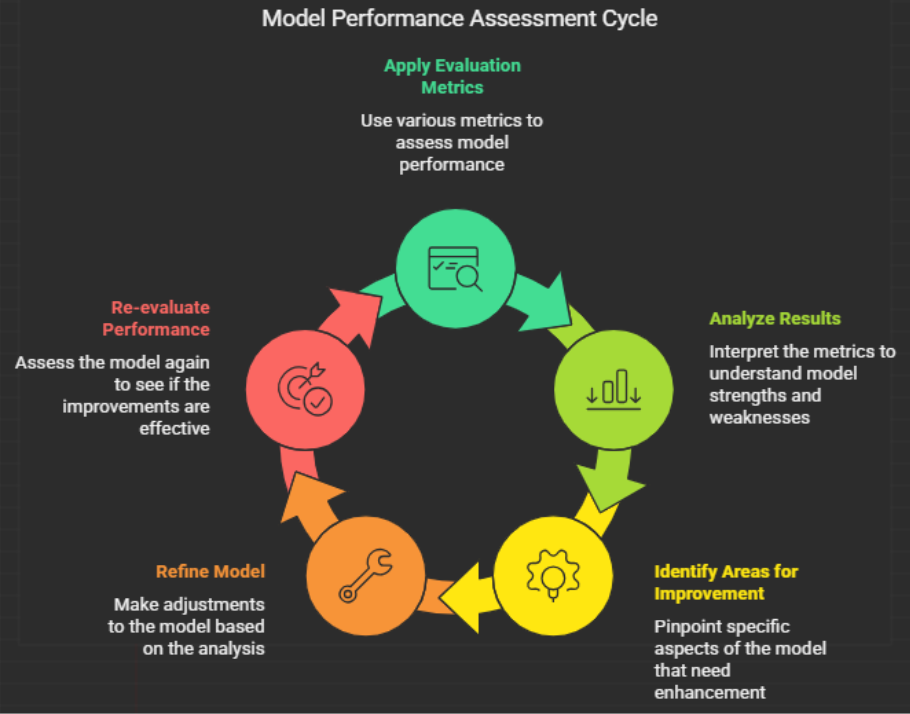
Why It Matters
Evaluation ensures the model performs well on unseen data.
8. Deployment
The model becomes operational for real-world applications after it passes validation.
Deployment Methods
- Web applications
- APIs
- Cloud platforms
- Business dashboards
Example: A recommendation system deployed on an e-commerce website.
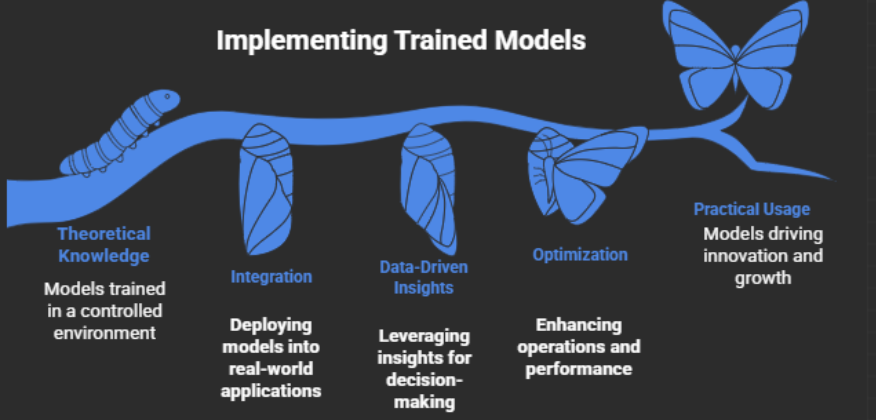
Why It Matters
Deployment transforms analytical results into useful business outcomes.
9. Feedback and Continuous Improvement
Data science is an ongoing process. Models need regular monitoring and improvement. Scientists need to conduct ongoing observation of their models because they need to make necessary enhancements.
Feedback Cycle Includes
- The system needs to maintain its performance at certain standards.
- Researchers collect additional information.
- The process requires researchers to update existing models.
- The process needs to enhance the correctness of its results.
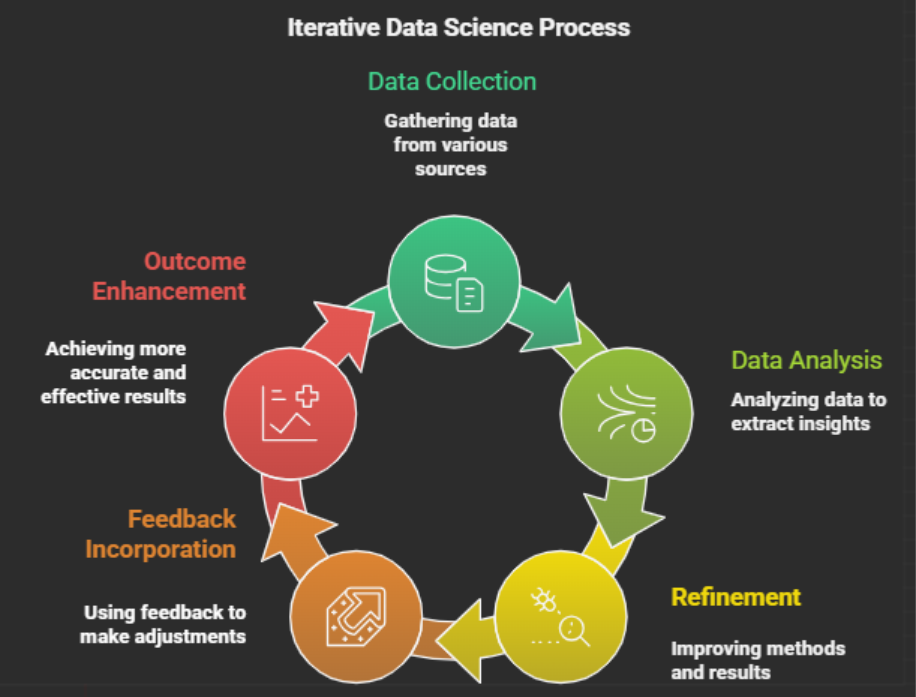
Why It Matters
Continuous improvement enables organizations to maintain performance over extended time periods.
Analytical Process Flow Summary
The complete workflow follows this sequence:
Problem Framing → Data Collection → Data Cleaning → Exploratory Data Analysis (EDA) → Feature Engineering → Modeling → Evaluation → Deployment → Feedback
The process operates in a loop which enhances both system performance and analytical understanding throughout time.
Conclusion
Data Science goes beyond model development — it is a systematic process that transforms raw data into valuable outcomes. The Analytical Process Flow connects every stage: problem understanding, data preparation, exploration, feature engineering, modeling, evaluation, deployment, and continuous improvement. Each step adds value while ensuring accuracy, reliability, and alignment with business goals.
Strong preparation builds strong models.
Proper evaluation ensures trustworthy results.
Deployment turns insight into real-world action.
This process is not a one-time effort — it is a continuous cycle of learning and optimization that converts raw data into clear insights and meaningful decisions.
For deeper context and practical extensions across AI, data science, automation, Python, careers, and industry trends, explore these related articles:
Your Next Step: Turn Learning Into Real Outcomes
Learning creates understanding. Progress comes from applying it with the right guidance. Use the table below to identify your immediate goal, understand what support fits best, and take a clear next step with Craze Neurons.
| What You Need Right Now! | What This Service Helps You Achieve | Starting At | Next Step |
| Upskilling Training | Real-world capability in Data Science, Python, AI, and related fields through hands-on training, live projects, mentorship, and strong conceptual grounding. | ₹2000 | 👉 Start upskilling |
| ATS-Friendly Resume | An ATS-optimized resume that reaches recruiters, built using skill-focused structuring and precise keyword optimization aligned with hiring systems. | ₹599 | 👉 Get an ATS-ready resume |
| Web Development | A responsive, SEO-friendly website designed for visibility and growth, using performance-driven design, clean structure, and search readiness. | ₹5000 | 👉Get Web site support |
| Android Projects | Practical Android development experience gained through real-time projects, guided mentorship, and clear explanations behind technical decisions. | ₹10000 | 👉 Get Android support |
| Digital Marketing | Increased brand visibility and engagement achieved through data-driven SEO, content strategy, social media, and email marketing campaigns. | ₹5000 | 👉 Get digital marketing support |
| Research Writing | Clear, plagiarism-free academic and technical writing delivered through structured, original research with academic integrity. | ₹5000 | 👉 Get research writing support |
❓ Frequently Asked Questions (FAQs) – Craze Neurons Services
0. Not sure which option fits your situation?
A short discussion is often enough to identify the most effective path. We help you clarify scope, effort, and outcomes before you commit.
👉 Talk to Craze Neurons on WhatsApp
1. What is included in the Upskilling Training?
We provide hands-on training in Data Science, Python, AI, and allied fields. This allows us to work with concepts and projects, see practical applications, and explore the deeper understanding of each topic.
2. How does the ATS-Friendly Resume service work?
Our team crafts ATS-optimized resumes that highlight skills, experience, and achievements. This is a service priced at ₹599 and acts as a lens to make the first impression clear, measurable, and effective.
3. What kind of websites can Craze Neurons build?
We build responsive and SEO-friendly websites for businesses, personal portfolios, and e-commerce platforms. This enables us to translate ideas into structure, visibility, and functional design.
4. What are the Android Projects about?
We offer real-time Android projects with guided mentorship. This gives us an opportunity to learn by doing, understand development from multiple angles, and apply knowledge in a controlled, real-world context.
5. What does Digital Marketing service include?
Our service covers SEO, social media campaigns, content marketing, and email strategy, allowing us to look at brand growth quantitatively and qualitatively, understanding what works and why.
6. What type of Research Writing do you provide?
We provide plagiarism-free academic and professional content, including thesis, reports, and papers. This allows us to express ideas, support arguments, and explore knowledge with depth and precision.
7. How can I get started with Craze Neurons services?
We can begin by clicking the WhatsApp link for the service we are interested in. This lets us communicate directly with the team and explore the steps together.
8. Can I use multiple services together?
Yes, we can combine training, resume, web, Android, digital marketing, and research services. This allows us to see synergies, plan strategically, and use resources effectively.
9. Is the training suitable for beginners?
Absolutely. The courses are designed for learners at all levels. They allow us to progress step by step, integrate projects, and build confidence alongside skills.
10. How long does it take to complete a service or course?
Duration depends on the service. Training programs vary by course length. Projects may take a few weeks, while resume, website, or research work can often be completed within a few days. This helps us plan, manage, and achieve outcomes efficiently.
Stay Connected with Us
🌐 Website 📢 Telegram 📸 Instagram 💼 LinkedIn ▶️ YouTube 📲 WhatsApp: +91 83681 95998